September 10, 2025
September 2025 – Energy News
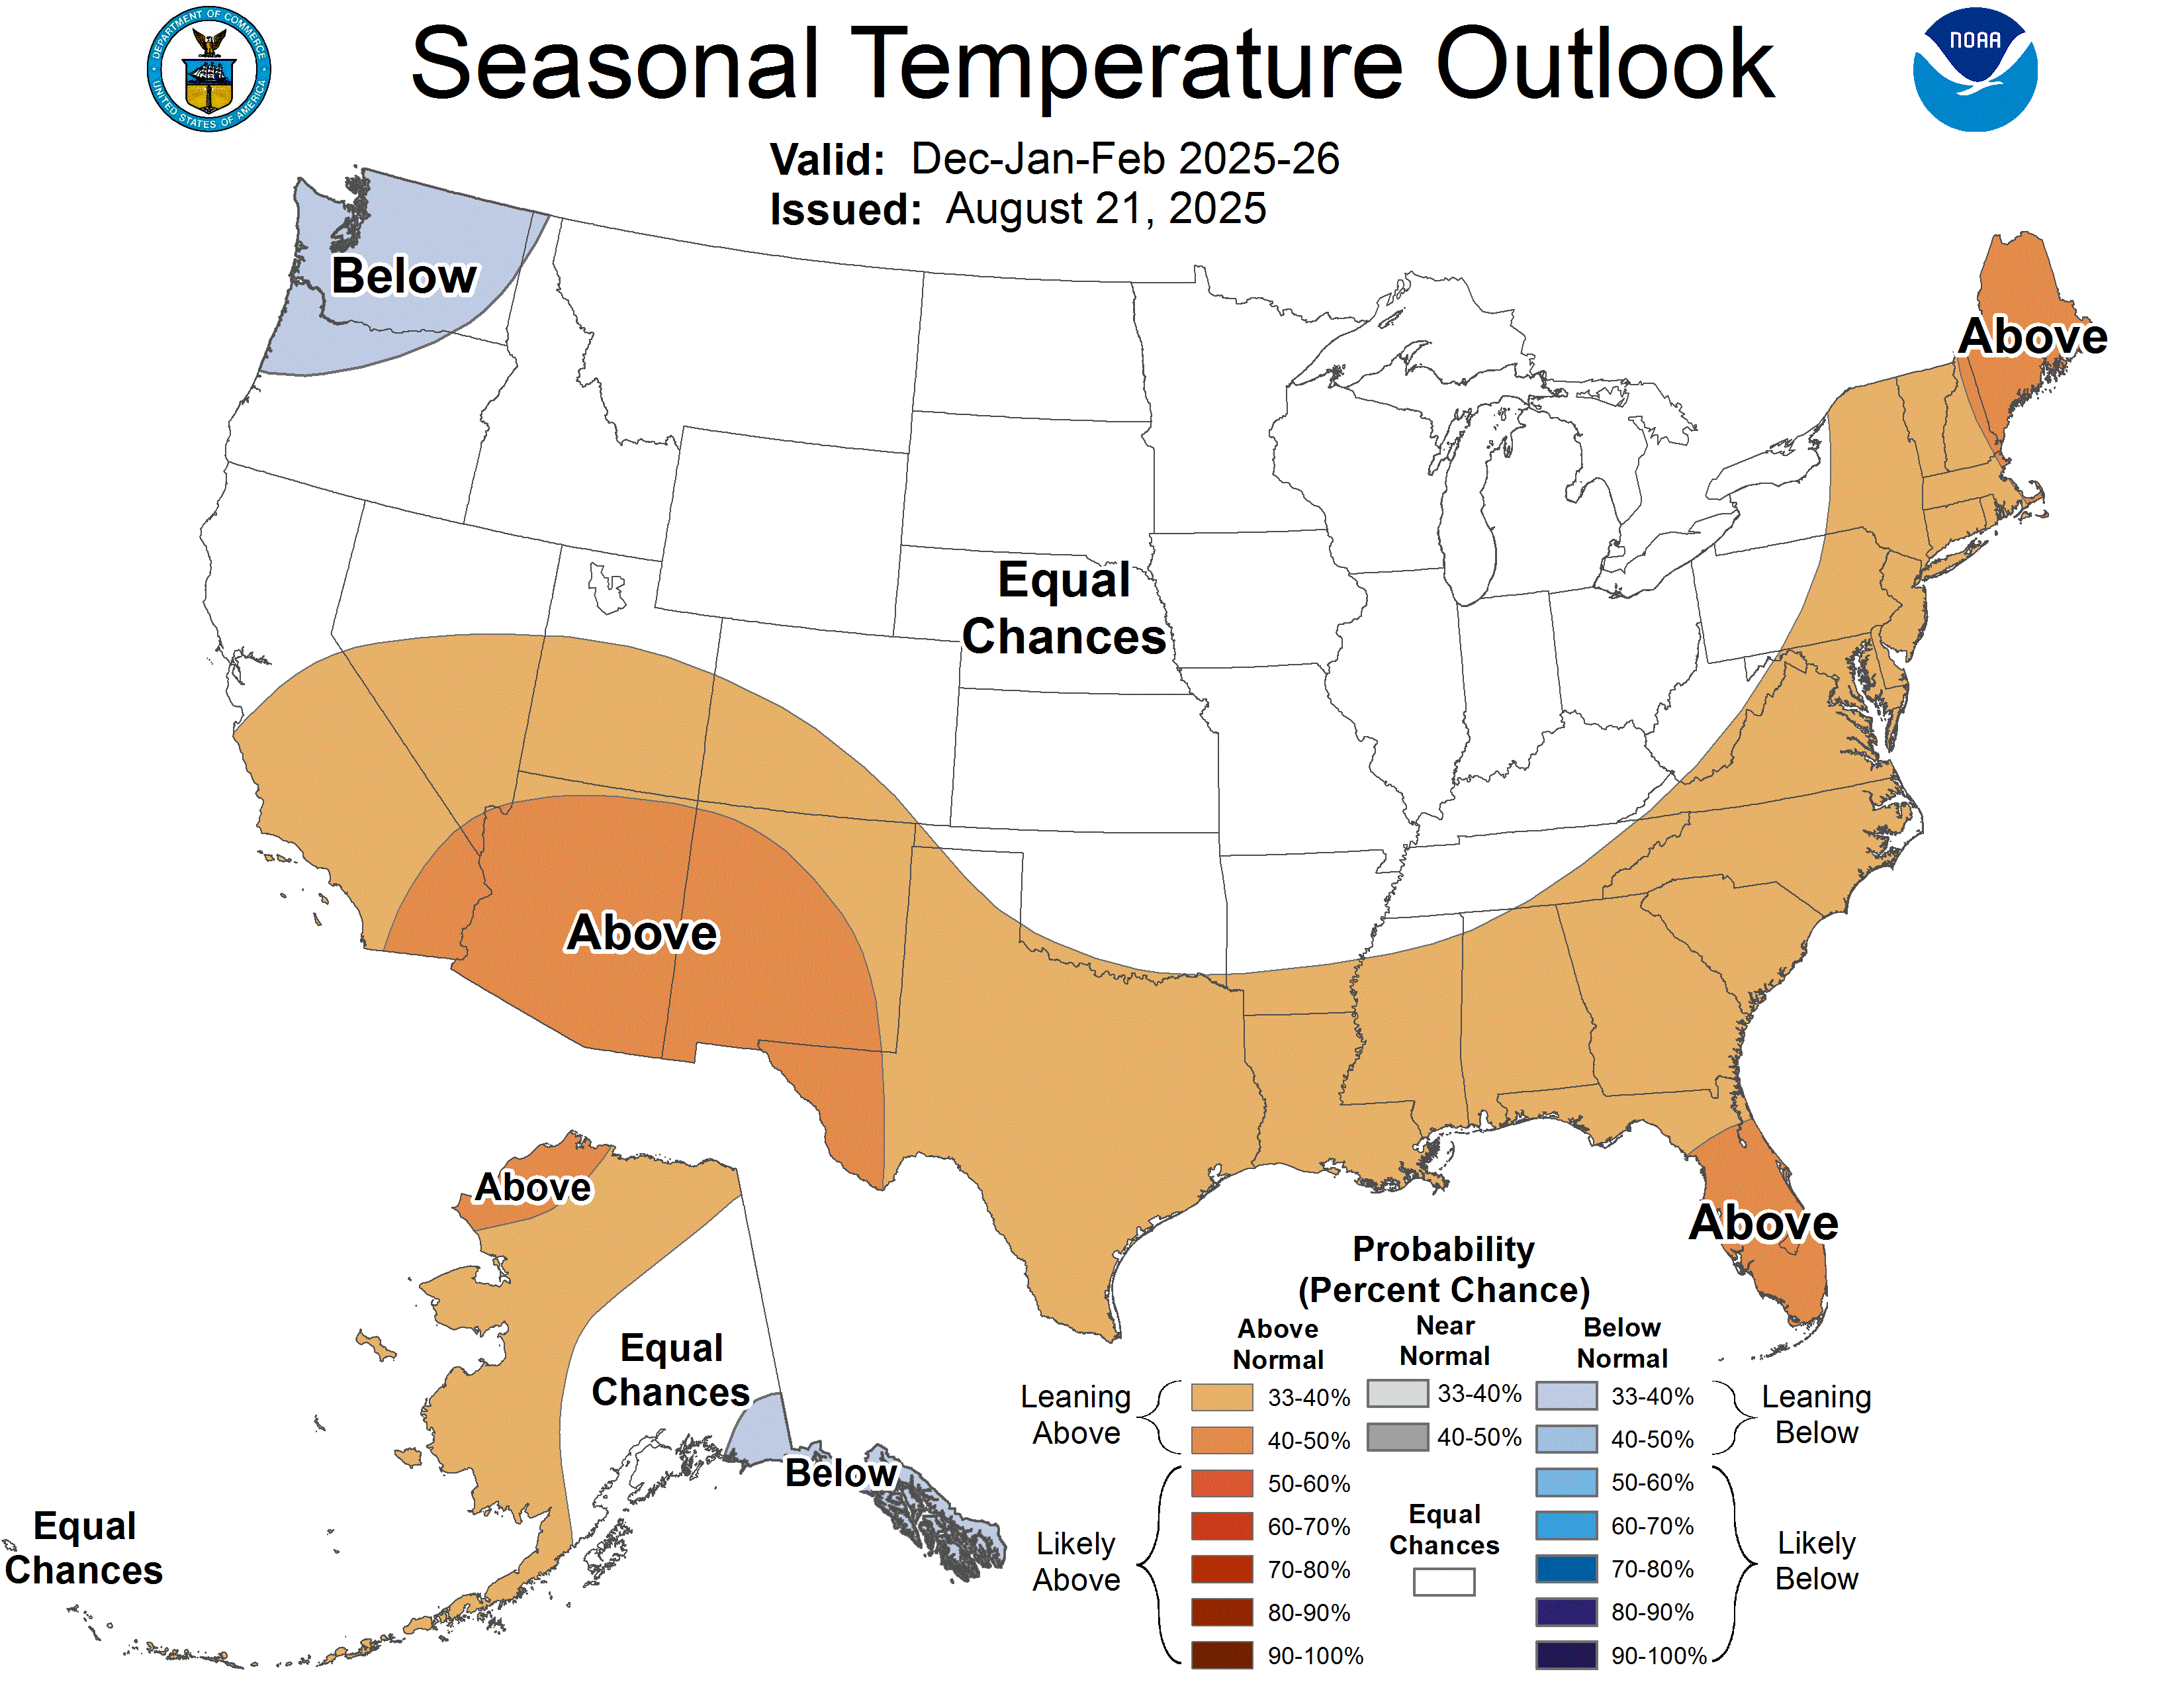
As summer temperatures give way to autumn weather, the National Oceanic and Atmospheric Administration (NOAA) has released a three-month outlook for December through February. While a few regions in the U.S. are predicted to experience above-average temperatures, most parts of the country are expected to have temperatures that are relatively normal for winter.
Domestic Demand
Cooler weather has swept across much of the U.S., leading to a 5.2 percent total natural gas demand decrease. Overall, U.S. experienced a decline in natural gas consumption by 11.9 percent compared to the previous year, with the power sector experiencing the most significant reduction at 21.4 percent. The industrial sector showed no change from the prior year, while the residential and commercial sector experienced a slight increase of 4.7 percent.
International Demand
In August, U.S. liquefied natural gas (LNG) exports reached a record high of 9.33 million metric tons (MMt), equivalent to heating approximately 6.16 million homes. This figure surpassed the previous peak of 9.23 MMt recorded in April. The Plaquemines LNG plant, the second largest in the U.S., has been ramping up production since it began operations in December 2022, further solidifying the U.S. position as the world's largest LNG exporter. Although the Plaquemines plant is still under construction, it is expected to be fully operational by the end of September.
As we enter the winter months, Europe is facing lower natural gas storage levels compared to 2024, primarily due to a significant decrease in imports of Russian natural gas. This situation has led Europe to become the largest destination for U.S. LNG exports. Meanwhile, Egypt is experiencing a decline in natural gas production and has announced plans to increase its imports of LNG.
Production & Supply
U.S. natural gas storage is currently 5.6 percent above the five-year average, showing growth since the beginning of the year when levels were below that average. Additionally, the number of natural gas rigs has significantly increased by 25.3 percent compared to last year.
Total U.S. natural gas supply is 2.4 percent higher than it was last year, reaching 111.9 billion cubic feet (Bcf). Both dry production and marketed production have increased from the previous year, with rises of 4.5 percent and 4.3 percent, respectively.
If you have any questions about the information in this newsletter or would like to talk to someone about your natural gas, please call your sales representative.
Market Data:
September 10, 2025

September 2025 – Energy News
September 10, 2025
As summer temperatures give way to autumn weather, the National Oceanic and Atmospheric Administration (NOAA) has released a three-month outlook for December through February. While a few regions in the U.S. are predicted to experience above-average temperatures, most parts of the country are expected to have temperatures that are relatively normal for winter.
Domestic Demand
Cooler weather has swept across much of the U.S., leading to a 5.2 percent total natural gas demand decrease. Overall, U.S. experienced a decline in natural gas consumption by 11.9 percent compared to the previous year, with the power sector experiencing the most significant reduction at 21.4 percent. The industrial sector showed no change from the prior year, while the residential and commercial sector experienced a slight increase of 4.7 percent.
International Demand
In August, U.S. liquefied natural gas (LNG) exports reached a record high of 9.33 million metric tons (MMt), equivalent to heating approximately 6.16 million homes. This figure surpassed the previous peak of 9.23 MMt recorded in April. The Plaquemines LNG plant, the second largest in the U.S., has been ramping up production since it began operations in December 2022, further solidifying the U.S. position as the world's largest LNG exporter. Although the Plaquemines plant is still under construction, it is expected to be fully operational by the end of September.
As we enter the winter months, Europe is facing lower natural gas storage levels compared to 2024, primarily due to a significant decrease in imports of Russian natural gas. This situation has led Europe to become the largest destination for U.S. LNG exports. Meanwhile, Egypt is experiencing a decline in natural gas production and has announced plans to increase its imports of LNG.
Production & Supply
U.S. natural gas storage is currently 5.6 percent above the five-year average, showing growth since the beginning of the year when levels were below that average. Additionally, the number of natural gas rigs has significantly increased by 25.3 percent compared to last year.
Total U.S. natural gas supply is 2.4 percent higher than it was last year, reaching 111.9 billion cubic feet (Bcf). Both dry production and marketed production have increased from the previous year, with rises of 4.5 percent and 4.3 percent, respectively.
If you have any questions about the information in this newsletter or would like to talk to someone about your natural gas, please call your sales representative.
Market Data:
September 10, 2025
September 10, 2025
September 2025 – Energy News
As summer temperatures give way to autumn weather, the National Oceanic and Atmospheric Administration (NOAA) has released a three-month outlook for December through February. While a few regions in the U.S. are predicted to experience above-average temperatures, most parts of the country are expected to have temperatures that are relatively normal for winter.
Domestic Demand
Cooler weather has swept across much of the U.S., leading to a 5.2 percent total natural gas demand decrease. Overall, U.S. experienced a decline in natural gas consumption by 11.9 percent compared to the previous year, with the power sector experiencing the most significant reduction at 21.4 percent. The industrial sector showed no change from the prior year, while the residential and commercial sector experienced a slight increase of 4.7 percent.
International Demand
In August, U.S. liquefied natural gas (LNG) exports reached a record high of 9.33 million metric tons (MMt), equivalent to heating approximately 6.16 million homes. This figure surpassed the previous peak of 9.23 MMt recorded in April. The Plaquemines LNG plant, the second largest in the U.S., has been ramping up production since it began operations in December 2022, further solidifying the U.S. position as the world's largest LNG exporter. Although the Plaquemines plant is still under construction, it is expected to be fully operational by the end of September.
As we enter the winter months, Europe is facing lower natural gas storage levels compared to 2024, primarily due to a significant decrease in imports of Russian natural gas. This situation has led Europe to become the largest destination for U.S. LNG exports. Meanwhile, Egypt is experiencing a decline in natural gas production and has announced plans to increase its imports of LNG.
Production & Supply
U.S. natural gas storage is currently 5.6 percent above the five-year average, showing growth since the beginning of the year when levels were below that average. Additionally, the number of natural gas rigs has significantly increased by 25.3 percent compared to last year.
Total U.S. natural gas supply is 2.4 percent higher than it was last year, reaching 111.9 billion cubic feet (Bcf). Both dry production and marketed production have increased from the previous year, with rises of 4.5 percent and 4.3 percent, respectively.
If you have any questions about the information in this newsletter or would like to talk to someone about your natural gas, please call your sales representative.

September 10, 2025
As summer temperatures give way to autumn weather, the National Oceanic and Atmospheric Administration (NOAA) has released a three-month outlook for December through February. While a few regions in the U.S. are predicted to experience above-average temperatures, most parts of the country are expected to have temperatures that are relatively normal for winter.
Domestic Demand
Cooler weather has swept across much of the U.S., leading to a 5.2 percent total natural gas demand decrease. Overall, U.S. experienced a decline in natural gas consumption by 11.9 percent compared to the previous year, with the power sector experiencing the most significant reduction at 21.4 percent. The industrial sector showed no change from the prior year, while the residential and commercial sector experienced a slight increase of 4.7 percent.
International Demand
In August, U.S. liquefied natural gas (LNG) exports reached a record high of 9.33 million metric tons (MMt), equivalent to heating approximately 6.16 million homes. This figure surpassed the previous peak of 9.23 MMt recorded in April. The Plaquemines LNG plant, the second largest in the U.S., has been ramping up production since it began operations in December 2022, further solidifying the U.S. position as the world's largest LNG exporter. Although the Plaquemines plant is still under construction, it is expected to be fully operational by the end of September.
As we enter the winter months, Europe is facing lower natural gas storage levels compared to 2024, primarily due to a significant decrease in imports of Russian natural gas. This situation has led Europe to become the largest destination for U.S. LNG exports. Meanwhile, Egypt is experiencing a decline in natural gas production and has announced plans to increase its imports of LNG.
Production & Supply
U.S. natural gas storage is currently 5.6 percent above the five-year average, showing growth since the beginning of the year when levels were below that average. Additionally, the number of natural gas rigs has significantly increased by 25.3 percent compared to last year.
Total U.S. natural gas supply is 2.4 percent higher than it was last year, reaching 111.9 billion cubic feet (Bcf). Both dry production and marketed production have increased from the previous year, with rises of 4.5 percent and 4.3 percent, respectively.
If you have any questions about the information in this newsletter or would like to talk to someone about your natural gas, please call your sales representative.
September 10, 2025
September 2025 – Energy News
As summer temperatures give way to autumn weather, the National Oceanic and Atmospheric Administration (NOAA) has released a three-month outlook for December through February. While a few regions in the U.S. are predicted to experience above-average temperatures, most parts of the country are expected to have temperatures that are relatively normal for winter.
Domestic Demand
Cooler weather has swept across much of the U.S., leading to a 5.2 percent total natural gas demand decrease. Overall, U.S. experienced a decline in natural gas consumption by 11.9 percent compared to the previous year, with the power sector experiencing the most significant reduction at 21.4 percent. The industrial sector showed no change from the prior year, while the residential and commercial sector experienced a slight increase of 4.7 percent.
International Demand
In August, U.S. liquefied natural gas (LNG) exports reached a record high of 9.33 million metric tons (MMt), equivalent to heating approximately 6.16 million homes. This figure surpassed the previous peak of 9.23 MMt recorded in April. The Plaquemines LNG plant, the second largest in the U.S., has been ramping up production since it began operations in December 2022, further solidifying the U.S. position as the world's largest LNG exporter. Although the Plaquemines plant is still under construction, it is expected to be fully operational by the end of September.
As we enter the winter months, Europe is facing lower natural gas storage levels compared to 2024, primarily due to a significant decrease in imports of Russian natural gas. This situation has led Europe to become the largest destination for U.S. LNG exports. Meanwhile, Egypt is experiencing a decline in natural gas production and has announced plans to increase its imports of LNG.
Production & Supply
U.S. natural gas storage is currently 5.6 percent above the five-year average, showing growth since the beginning of the year when levels were below that average. Additionally, the number of natural gas rigs has significantly increased by 25.3 percent compared to last year.
Total U.S. natural gas supply is 2.4 percent higher than it was last year, reaching 111.9 billion cubic feet (Bcf). Both dry production and marketed production have increased from the previous year, with rises of 4.5 percent and 4.3 percent, respectively.
If you have any questions about the information in this newsletter or would like to talk to someone about your natural gas, please call your sales representative.
Make Your Choice Gas Selection in Three Easy Steps
Click here to access our online tool, or call our Choice gas commodity experts at 1 (877) 790-4990.
Step 1: Enter your account number
- Your Black Hills Energy account number is located at the top right-hand corner of your bill.
Step 2: Review price options and make your selection
Step 3: Confirm your selection and enter your control number
- You received a control number in your 2026 Choice Gas selection packet mailed to you from Black Hills Energy. If you cannot locate this, you can retrieve your control number by calling 877-245-3506 or visit choicegas.com
Once enrolled, you will be removed from supplier marketing communications within 24 hours.


Sign Up for Our Energy Newsletters
Sign UpRecent Posts