March 11, 2026
March 2026 – Energy News
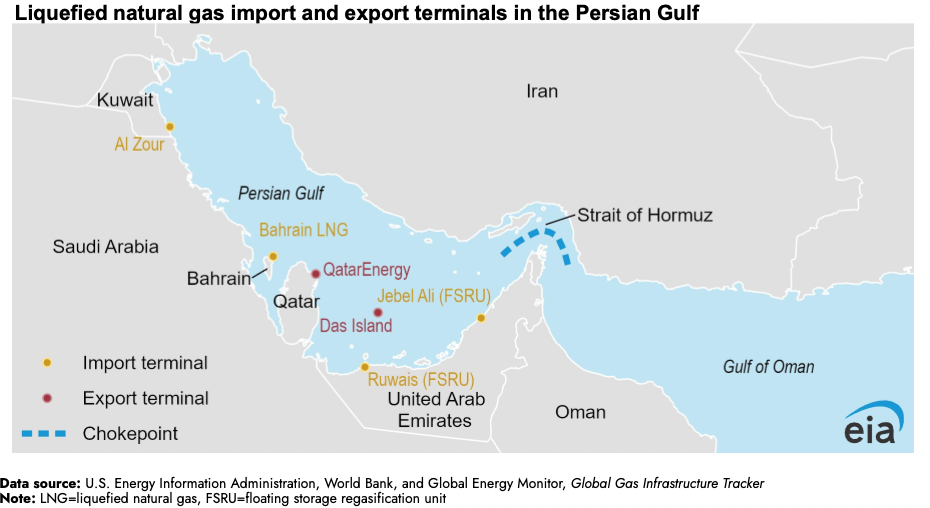
Last month, the U.S. natural gas market was still recovering from one of the most severe and widespread winter storms since Winter Storm Uri in 2021, which caused significant volatility across energy markets. This month, however, global geopolitical tensions have taken center stage. Escalating conflict involving Iran has disrupted energy markets and raised concerns about global supply chains. The situation has already impacted liquefied natural gas (LNG) infrastructure in the Persian Gulf—home to one of the world’s largest LNG exporters—and threatened shipping through the Strait of Hormuz, a critical route for roughly 20 percent of global LNG and oil trade. As a result, energy markets are once again facing heightened uncertainty and price volatility.
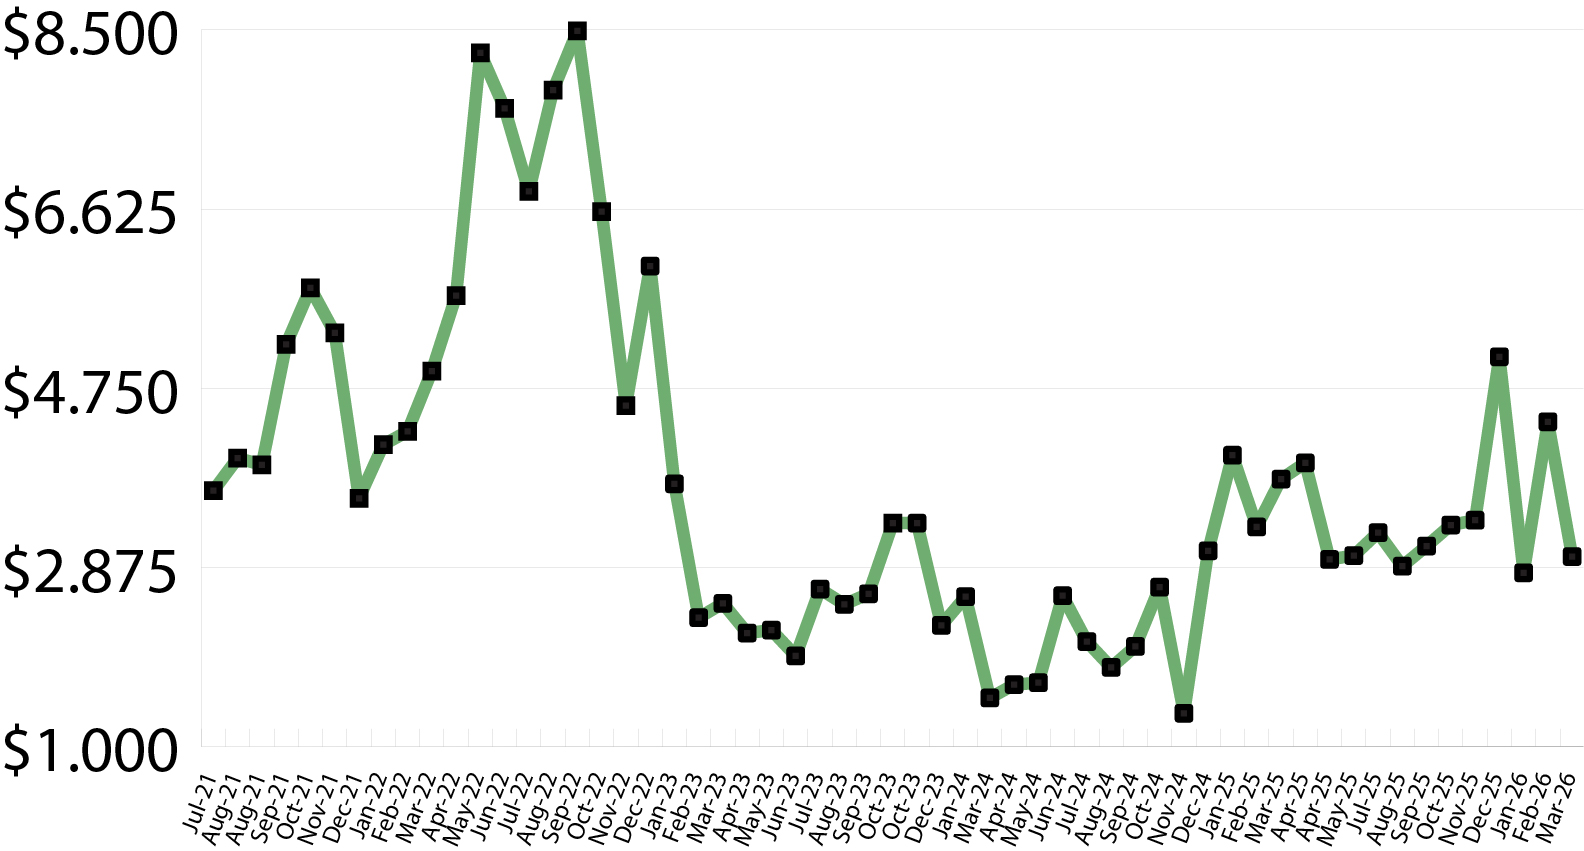
Natural gas prices around the world rose last week after an attack from Iran forced the shutdown of a major LNG export facility. In the United States, prices also moved higher but rose a more modest 11 percent, largely due to strong domestic storage levels, record production, warmer-than-normal temperatures, and LNG export capacity already operating near its limits.
Domestic Demand
The U.S. Energy Information Administration’s (EIA) weekly storage report for the week ending February 27 showed a 132 billion cubic feet (Bcf) withdrawal. However, market expectations point to withdrawals potentially falling out of the double digits due to drops in demand, due to unusually warm temperatures more typical for May.
International Demand
After QatarEnergy halted LNG production, benchmark natural gas prices in Europe surged by 67 percent. Liquefied natural gas accounts for roughly 45 percent of Europe’s total gas supply, making the region particularly sensitive to disruptions in global LNG flows. Unlike the United States, Europe is expected to end the heating season with storage levels well below normal, projected at just 22–27 percent of capacity compared to the five-year average of about 41 percent. With QatarEnergy declaring force majeure on LNG exports, it could take weeks or even months before the facility is able to restart. As Europe begins refilling storage this summer, it will likely face elevated prices, and with U.S. LNG export capacity already operating at maximum levels, there is limited ability for the United States to quickly increase output to offset the lost Qatari supply.
Production & Supply
As of February 27, U.S. natural gas storage levels stood at 1,886 Bcf, which is 6.5 percent higher than the same time last year but 2.2 percent below the five-year average. If warmer-than-normal temperatures persist, the United States could enter the storage injection season earlier than usual.
According to Baker Hughes, the U.S. began March with 132 natural gas rigs in operation. While this is slightly lower than the previous week, it is still about 30 percent higher than the number of rigs operating at this time last year.
If you have any questions about the information in this newsletter or would like to talk to someone about your natural gas, please call your sales representative.
Market Data:
March 11, 2026

March 2026 – Energy News
March 11, 2026
Last month, the U.S. natural gas market was still recovering from one of the most severe and widespread winter storms since Winter Storm Uri in 2021, which caused significant volatility across energy markets. This month, however, global geopolitical tensions have taken center stage. Escalating conflict involving Iran has disrupted energy markets and raised concerns about global supply chains. The situation has already impacted liquefied natural gas (LNG) infrastructure in the Persian Gulf—home to one of the world’s largest LNG exporters—and threatened shipping through the Strait of Hormuz, a critical route for roughly 20 percent of global LNG and oil trade. As a result, energy markets are once again facing heightened uncertainty and price volatility.
Natural gas prices around the world rose last week after an attack from Iran forced the shutdown of a major LNG export facility. In the United States, prices also moved higher but rose a more modest 11 percent, largely due to strong domestic storage levels, record production, warmer-than-normal temperatures, and LNG export capacity already operating near its limits.
Domestic Demand
The U.S. Energy Information Administration’s (EIA) weekly storage report for the week ending February 27 showed a 132 billion cubic feet (Bcf) withdrawal. However, market expectations point to withdrawals potentially falling out of the double digits due to drops in demand, due to unusually warm temperatures more typical for May.
International Demand
After QatarEnergy halted LNG production, benchmark natural gas prices in Europe surged by 67 percent. Liquefied natural gas accounts for roughly 45 percent of Europe’s total gas supply, making the region particularly sensitive to disruptions in global LNG flows. Unlike the United States, Europe is expected to end the heating season with storage levels well below normal, projected at just 22–27 percent of capacity compared to the five-year average of about 41 percent. With QatarEnergy declaring force majeure on LNG exports, it could take weeks or even months before the facility is able to restart. As Europe begins refilling storage this summer, it will likely face elevated prices, and with U.S. LNG export capacity already operating at maximum levels, there is limited ability for the United States to quickly increase output to offset the lost Qatari supply.
Production & Supply
As of February 27, U.S. natural gas storage levels stood at 1,886 Bcf, which is 6.5 percent higher than the same time last year but 2.2 percent below the five-year average. If warmer-than-normal temperatures persist, the United States could enter the storage injection season earlier than usual.
According to Baker Hughes, the U.S. began March with 132 natural gas rigs in operation. While this is slightly lower than the previous week, it is still about 30 percent higher than the number of rigs operating at this time last year.
If you have any questions about the information in this newsletter or would like to talk to someone about your natural gas, please call your sales representative.
Market Data:
March 11, 2026
March 11, 2026
March 2026 – Energy News
Last month, the U.S. natural gas market was still recovering from one of the most severe and widespread winter storms since Winter Storm Uri in 2021, which caused significant volatility across energy markets. This month, however, global geopolitical tensions have taken center stage. Escalating conflict involving Iran has disrupted energy markets and raised concerns about global supply chains. The situation has already impacted liquefied natural gas (LNG) infrastructure in the Persian Gulf—home to one of the world’s largest LNG exporters—and threatened shipping through the Strait of Hormuz, a critical route for roughly 20 percent of global LNG and oil trade. As a result, energy markets are once again facing heightened uncertainty and price volatility.
Natural gas prices around the world rose last week after an attack from Iran forced the shutdown of a major LNG export facility. In the United States, prices also moved higher but rose a more modest 11 percent, largely due to strong domestic storage levels, record production, warmer-than-normal temperatures, and LNG export capacity already operating near its limits.
Domestic Demand
The U.S. Energy Information Administration’s (EIA) weekly storage report for the week ending February 27 showed a 132 billion cubic feet (Bcf) withdrawal. However, market expectations point to withdrawals potentially falling out of the double digits due to drops in demand, due to unusually warm temperatures more typical for May.
International Demand
After QatarEnergy halted LNG production, benchmark natural gas prices in Europe surged by 67 percent. Liquefied natural gas accounts for roughly 45 percent of Europe’s total gas supply, making the region particularly sensitive to disruptions in global LNG flows. Unlike the United States, Europe is expected to end the heating season with storage levels well below normal, projected at just 22–27 percent of capacity compared to the five-year average of about 41 percent. With QatarEnergy declaring force majeure on LNG exports, it could take weeks or even months before the facility is able to restart. As Europe begins refilling storage this summer, it will likely face elevated prices, and with U.S. LNG export capacity already operating at maximum levels, there is limited ability for the United States to quickly increase output to offset the lost Qatari supply.
Production & Supply
As of February 27, U.S. natural gas storage levels stood at 1,886 Bcf, which is 6.5 percent higher than the same time last year but 2.2 percent below the five-year average. If warmer-than-normal temperatures persist, the United States could enter the storage injection season earlier than usual.
According to Baker Hughes, the U.S. began March with 132 natural gas rigs in operation. While this is slightly lower than the previous week, it is still about 30 percent higher than the number of rigs operating at this time last year.
If you have any questions about the information in this newsletter or would like to talk to someone about your natural gas, please call your sales representative.

March 11, 2026
Last month, the U.S. natural gas market was still recovering from one of the most severe and widespread winter storms since Winter Storm Uri in 2021, which caused significant volatility across energy markets. This month, however, global geopolitical tensions have taken center stage. Escalating conflict involving Iran has disrupted energy markets and raised concerns about global supply chains. The situation has already impacted liquefied natural gas (LNG) infrastructure in the Persian Gulf—home to one of the world’s largest LNG exporters—and threatened shipping through the Strait of Hormuz, a critical route for roughly 20 percent of global LNG and oil trade. As a result, energy markets are once again facing heightened uncertainty and price volatility.
Natural gas prices around the world rose last week after an attack from Iran forced the shutdown of a major LNG export facility. In the United States, prices also moved higher but rose a more modest 11 percent, largely due to strong domestic storage levels, record production, warmer-than-normal temperatures, and LNG export capacity already operating near its limits.
Domestic Demand
The U.S. Energy Information Administration’s (EIA) weekly storage report for the week ending February 27 showed a 132 billion cubic feet (Bcf) withdrawal. However, market expectations point to withdrawals potentially falling out of the double digits due to drops in demand, due to unusually warm temperatures more typical for May.
International Demand
After QatarEnergy halted LNG production, benchmark natural gas prices in Europe surged by 67 percent. Liquefied natural gas accounts for roughly 45 percent of Europe’s total gas supply, making the region particularly sensitive to disruptions in global LNG flows. Unlike the United States, Europe is expected to end the heating season with storage levels well below normal, projected at just 22–27 percent of capacity compared to the five-year average of about 41 percent. With QatarEnergy declaring force majeure on LNG exports, it could take weeks or even months before the facility is able to restart. As Europe begins refilling storage this summer, it will likely face elevated prices, and with U.S. LNG export capacity already operating at maximum levels, there is limited ability for the United States to quickly increase output to offset the lost Qatari supply.
Production & Supply
As of February 27, U.S. natural gas storage levels stood at 1,886 Bcf, which is 6.5 percent higher than the same time last year but 2.2 percent below the five-year average. If warmer-than-normal temperatures persist, the United States could enter the storage injection season earlier than usual.
According to Baker Hughes, the U.S. began March with 132 natural gas rigs in operation. While this is slightly lower than the previous week, it is still about 30 percent higher than the number of rigs operating at this time last year.
If you have any questions about the information in this newsletter or would like to talk to someone about your natural gas, please call your sales representative.
March 11, 2026
March 2026 – Energy News
Last month, the U.S. natural gas market was still recovering from one of the most severe and widespread winter storms since Winter Storm Uri in 2021, which caused significant volatility across energy markets. This month, however, global geopolitical tensions have taken center stage. Escalating conflict involving Iran has disrupted energy markets and raised concerns about global supply chains. The situation has already impacted liquefied natural gas (LNG) infrastructure in the Persian Gulf—home to one of the world’s largest LNG exporters—and threatened shipping through the Strait of Hormuz, a critical route for roughly 20 percent of global LNG and oil trade. As a result, energy markets are once again facing heightened uncertainty and price volatility.
Natural gas prices around the world rose last week after an attack from Iran forced the shutdown of a major LNG export facility. In the United States, prices also moved higher but rose a more modest 11 percent, largely due to strong domestic storage levels, record production, warmer-than-normal temperatures, and LNG export capacity already operating near its limits.
Domestic Demand
The U.S. Energy Information Administration’s (EIA) weekly storage report for the week ending February 27 showed a 132 billion cubic feet (Bcf) withdrawal. However, market expectations point to withdrawals potentially falling out of the double digits due to drops in demand, due to unusually warm temperatures more typical for May.
International Demand
After QatarEnergy halted LNG production, benchmark natural gas prices in Europe surged by 67 percent. Liquefied natural gas accounts for roughly 45 percent of Europe’s total gas supply, making the region particularly sensitive to disruptions in global LNG flows. Unlike the United States, Europe is expected to end the heating season with storage levels well below normal, projected at just 22–27 percent of capacity compared to the five-year average of about 41 percent. With QatarEnergy declaring force majeure on LNG exports, it could take weeks or even months before the facility is able to restart. As Europe begins refilling storage this summer, it will likely face elevated prices, and with U.S. LNG export capacity already operating at maximum levels, there is limited ability for the United States to quickly increase output to offset the lost Qatari supply.
Production & Supply
As of February 27, U.S. natural gas storage levels stood at 1,886 Bcf, which is 6.5 percent higher than the same time last year but 2.2 percent below the five-year average. If warmer-than-normal temperatures persist, the United States could enter the storage injection season earlier than usual.
According to Baker Hughes, the U.S. began March with 132 natural gas rigs in operation. While this is slightly lower than the previous week, it is still about 30 percent higher than the number of rigs operating at this time last year.
If you have any questions about the information in this newsletter or would like to talk to someone about your natural gas, please call your sales representative.
Make Your Choice Gas Selection in Three Easy Steps
Click here to access our online tool, or call our Choice gas commodity experts at 1 (877) 790-4990.
Step 1: Enter your account number
- Your Black Hills Energy account number is located at the top right-hand corner of your bill.
Step 2: Review price options and make your selection
Step 3: Confirm your selection and enter your control number
- You received a control number in your 2026 Choice Gas selection packet mailed to you from Black Hills Energy. If you cannot locate this, you can retrieve your control number by calling 877-245-3506 or visit choicegas.com
Once enrolled, you will be removed from supplier marketing communications within 24 hours.


Sign Up for Our Energy Newsletters
Sign UpRecent Posts