April 9, 2026
April 2026 – Energy News
As we begin the first full month of spring, natural gas demand saw a brief bump as cooler temperatures returned across much of the U.S. Meanwhile, tensions in the Middle East continue to play a role as U.S. liquefied natural gas (LNG) exports reached record levels.
Domestic Demand
Domestic demand saw a notable uptick, led by a 7,313 MMcf/d increase in residential and commercial (ResComm) consumption. This rise was primarily driven by stronger demand in the Northeast and Midcontinent regions, which climbed by 4,317 MMcf/d and 2,877 MMcf/d
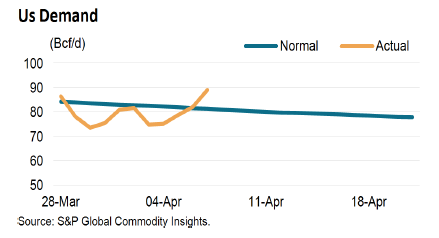
Looking ahead, the National Oceanic and Atmospheric Administration’s (NOAA) 6-10-day forecast calls for warmer-than-normal temperatures across most of the country, which will likely dampen demand in the coming weeks.
International Demand
U.S. LNG exports reached a record 11.7 million metric tons in March, as facilities operated above capacity. Demand was driven by global supply disruptions tied to Middle East conflict, which has impacted a significant portion of LNG flows and forced buyers—particularly in Asia—to seek alternative sources.
At the same time, new U.S. export capacity is coming online, including Golden Pass LNG and Cheniere’s Corpus Christi expansion, positioning the U.S. for continued growth in exports.
Europe remained the largest buyer, importing 7.49 million tons (about 64% of total exports), as low storage levels continue to support strong demand.
Production & Supply
Natural gas storage levels continue to track above historical norms as the withdrawal season comes to a close. For the week ending March 27, net injections totaled 36 Bcf—well above the five-year average, which typically reflects a 4 Bcf withdrawal for this time of year, and slightly higher than last year’s 30 Bcf injection.
According to EIA estimates, working gas in storage stands at 1,865 Bcf, which is 54 Bcf (3%) above the five-year average and 96 Bcf (5%) higher than this time last year.
While withdrawals throughout the season have run about 6% higher than the five-year average, overall inventory levels remain healthy. If withdrawal rates align with historical averages through the end of March, storage is expected to finish near 1,872 Bcf—continuing to sit comfortably above typical levels for this time of year
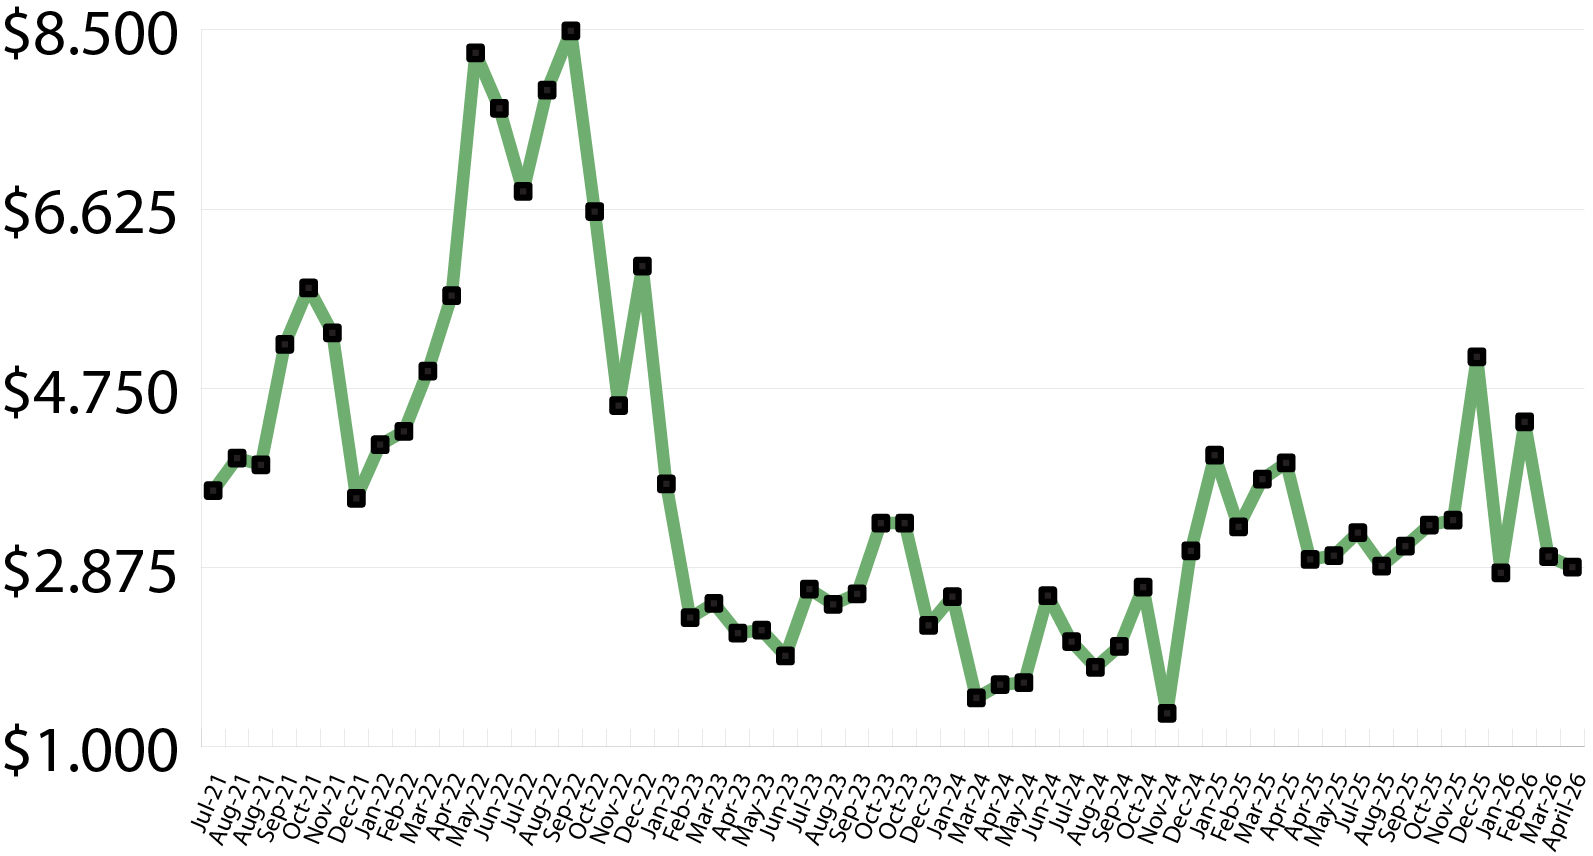
Market Data:
April 9, 2026

April 2026 – Energy News
April 9, 2026
As we begin the first full month of spring, natural gas demand saw a brief bump as cooler temperatures returned across much of the U.S. Meanwhile, tensions in the Middle East continue to play a role as U.S. liquefied natural gas (LNG) exports reached record levels.
Domestic Demand
Domestic demand saw a notable uptick, led by a 7,313 MMcf/d increase in residential and commercial (ResComm) consumption. This rise was primarily driven by stronger demand in the Northeast and Midcontinent regions, which climbed by 4,317 MMcf/d and 2,877 MMcf/d
Looking ahead, the National Oceanic and Atmospheric Administration’s (NOAA) 6-10-day forecast calls for warmer-than-normal temperatures across most of the country, which will likely dampen demand in the coming weeks.
International Demand
U.S. LNG exports reached a record 11.7 million metric tons in March, as facilities operated above capacity. Demand was driven by global supply disruptions tied to Middle East conflict, which has impacted a significant portion of LNG flows and forced buyers—particularly in Asia—to seek alternative sources.
At the same time, new U.S. export capacity is coming online, including Golden Pass LNG and Cheniere’s Corpus Christi expansion, positioning the U.S. for continued growth in exports.
Europe remained the largest buyer, importing 7.49 million tons (about 64% of total exports), as low storage levels continue to support strong demand.
Production & Supply
Natural gas storage levels continue to track above historical norms as the withdrawal season comes to a close. For the week ending March 27, net injections totaled 36 Bcf—well above the five-year average, which typically reflects a 4 Bcf withdrawal for this time of year, and slightly higher than last year’s 30 Bcf injection.
According to EIA estimates, working gas in storage stands at 1,865 Bcf, which is 54 Bcf (3%) above the five-year average and 96 Bcf (5%) higher than this time last year.
While withdrawals throughout the season have run about 6% higher than the five-year average, overall inventory levels remain healthy. If withdrawal rates align with historical averages through the end of March, storage is expected to finish near 1,872 Bcf—continuing to sit comfortably above typical levels for this time of year
Market Data:
April 9, 2026
April 9, 2026
April 2026 – Energy News
As we begin the first full month of spring, natural gas demand saw a brief bump as cooler temperatures returned across much of the U.S. Meanwhile, tensions in the Middle East continue to play a role as U.S. liquefied natural gas (LNG) exports reached record levels.
Domestic Demand
Domestic demand saw a notable uptick, led by a 7,313 MMcf/d increase in residential and commercial (ResComm) consumption. This rise was primarily driven by stronger demand in the Northeast and Midcontinent regions, which climbed by 4,317 MMcf/d and 2,877 MMcf/d
Looking ahead, the National Oceanic and Atmospheric Administration’s (NOAA) 6-10-day forecast calls for warmer-than-normal temperatures across most of the country, which will likely dampen demand in the coming weeks.
International Demand
U.S. LNG exports reached a record 11.7 million metric tons in March, as facilities operated above capacity. Demand was driven by global supply disruptions tied to Middle East conflict, which has impacted a significant portion of LNG flows and forced buyers—particularly in Asia—to seek alternative sources.
At the same time, new U.S. export capacity is coming online, including Golden Pass LNG and Cheniere’s Corpus Christi expansion, positioning the U.S. for continued growth in exports.
Europe remained the largest buyer, importing 7.49 million tons (about 64% of total exports), as low storage levels continue to support strong demand.
Production & Supply
Natural gas storage levels continue to track above historical norms as the withdrawal season comes to a close. For the week ending March 27, net injections totaled 36 Bcf—well above the five-year average, which typically reflects a 4 Bcf withdrawal for this time of year, and slightly higher than last year’s 30 Bcf injection.
According to EIA estimates, working gas in storage stands at 1,865 Bcf, which is 54 Bcf (3%) above the five-year average and 96 Bcf (5%) higher than this time last year.
While withdrawals throughout the season have run about 6% higher than the five-year average, overall inventory levels remain healthy. If withdrawal rates align with historical averages through the end of March, storage is expected to finish near 1,872 Bcf—continuing to sit comfortably above typical levels for this time of year

April 9, 2026
As we begin the first full month of spring, natural gas demand saw a brief bump as cooler temperatures returned across much of the U.S. Meanwhile, tensions in the Middle East continue to play a role as U.S. liquefied natural gas (LNG) exports reached record levels.
Domestic Demand
Domestic demand saw a notable uptick, led by a 7,313 MMcf/d increase in residential and commercial (ResComm) consumption. This rise was primarily driven by stronger demand in the Northeast and Midcontinent regions, which climbed by 4,317 MMcf/d and 2,877 MMcf/d
Looking ahead, the National Oceanic and Atmospheric Administration’s (NOAA) 6-10-day forecast calls for warmer-than-normal temperatures across most of the country, which will likely dampen demand in the coming weeks.
International Demand
U.S. LNG exports reached a record 11.7 million metric tons in March, as facilities operated above capacity. Demand was driven by global supply disruptions tied to Middle East conflict, which has impacted a significant portion of LNG flows and forced buyers—particularly in Asia—to seek alternative sources.
At the same time, new U.S. export capacity is coming online, including Golden Pass LNG and Cheniere’s Corpus Christi expansion, positioning the U.S. for continued growth in exports.
Europe remained the largest buyer, importing 7.49 million tons (about 64% of total exports), as low storage levels continue to support strong demand.
Production & Supply
Natural gas storage levels continue to track above historical norms as the withdrawal season comes to a close. For the week ending March 27, net injections totaled 36 Bcf—well above the five-year average, which typically reflects a 4 Bcf withdrawal for this time of year, and slightly higher than last year’s 30 Bcf injection.
According to EIA estimates, working gas in storage stands at 1,865 Bcf, which is 54 Bcf (3%) above the five-year average and 96 Bcf (5%) higher than this time last year.
While withdrawals throughout the season have run about 6% higher than the five-year average, overall inventory levels remain healthy. If withdrawal rates align with historical averages through the end of March, storage is expected to finish near 1,872 Bcf—continuing to sit comfortably above typical levels for this time of year
April 9, 2026
April 2026 – Energy News
As we begin the first full month of spring, natural gas demand saw a brief bump as cooler temperatures returned across much of the U.S. Meanwhile, tensions in the Middle East continue to play a role as U.S. liquefied natural gas (LNG) exports reached record levels.
Domestic Demand
Domestic demand saw a notable uptick, led by a 7,313 MMcf/d increase in residential and commercial (ResComm) consumption. This rise was primarily driven by stronger demand in the Northeast and Midcontinent regions, which climbed by 4,317 MMcf/d and 2,877 MMcf/d
Looking ahead, the National Oceanic and Atmospheric Administration’s (NOAA) 6-10-day forecast calls for warmer-than-normal temperatures across most of the country, which will likely dampen demand in the coming weeks.
International Demand
U.S. LNG exports reached a record 11.7 million metric tons in March, as facilities operated above capacity. Demand was driven by global supply disruptions tied to Middle East conflict, which has impacted a significant portion of LNG flows and forced buyers—particularly in Asia—to seek alternative sources.
At the same time, new U.S. export capacity is coming online, including Golden Pass LNG and Cheniere’s Corpus Christi expansion, positioning the U.S. for continued growth in exports.
Europe remained the largest buyer, importing 7.49 million tons (about 64% of total exports), as low storage levels continue to support strong demand.
Production & Supply
Natural gas storage levels continue to track above historical norms as the withdrawal season comes to a close. For the week ending March 27, net injections totaled 36 Bcf—well above the five-year average, which typically reflects a 4 Bcf withdrawal for this time of year, and slightly higher than last year’s 30 Bcf injection.
According to EIA estimates, working gas in storage stands at 1,865 Bcf, which is 54 Bcf (3%) above the five-year average and 96 Bcf (5%) higher than this time last year.
While withdrawals throughout the season have run about 6% higher than the five-year average, overall inventory levels remain healthy. If withdrawal rates align with historical averages through the end of March, storage is expected to finish near 1,872 Bcf—continuing to sit comfortably above typical levels for this time of year
Make Your Choice Gas Selection in Three Easy Steps
Click here to access our online tool, or call our Choice gas commodity experts at 1 (877) 790-4990.
Step 1: Enter your account number
- Your Black Hills Energy account number is located at the top right-hand corner of your bill.
Step 2: Review price options and make your selection
Step 3: Confirm your selection and enter your control number
- You received a control number in your 2026 Choice Gas selection packet mailed to you from Black Hills Energy. If you cannot locate this, you can retrieve your control number by calling 877-245-3506 or visit choicegas.com
Once enrolled, you will be removed from supplier marketing communications within 24 hours.


Sign Up for Our Energy Newsletters
Sign Up