May 13, 2026
May 2026 – Energy News
The spring shoulder season is drawing to a close, with power demand tied to air conditioning expected to build later this month and strengthen into June. Early forecasts pointing to one of the hottest summers on record are already shaping market expectations. Meanwhile, persistent geopolitical tensions in the Middle East continue to underpin natural gas prices, with U.S. LNG exports running near capacity.
Domestic Demand
Although much of the U.S. experienced warmer-than-normal temperatures earlier this spring, cooler weather at the start of this month helped maintain natural gas demand. The most significant change in U.S. fundamentals on Monday was a 2,115 MMcf/d increase in residential and commercial demand, driven primarily by gains in the Midcontinent and Northeast regions, which rose by 1,122 MMcf/d and 965 MMcf/d, respectively.

Looking ahead to this summer, the National Oceanic and Atmospheric Administration (NOAA) is forecasting the development of a strong El Niño weather pattern. Some meteorologists are referring to the potential event as a “super” El Niño, which could bring record-setting temperatures and increase natural gas demand for electricity generation as cooling needs rise across the country.
International Demand
International LNG demand remains elevated as global markets continue to respond to supply disruptions tied to the ongoing conflict involving Iran. Tensions surrounding the Strait of Hormuz have significantly impacted global energy flows, with nearly 20 percent of the world’s LNG supply affected by disruptions to one of the most critical energy transit routes in the world.
At the same time, new U.S. LNG export capacity continues to come online. On April 22, 2026, Golden Pass LNG shipped its first LNG cargo from Train 1, just 23 days after achieving first LNG production in March. Golden Pass is currently the only new U.S. LNG export facility expected to begin shipments in 2026, further highlighting the importance of U.S. LNG exports in helping offset tightening global supply conditions.
The project includes three liquefaction trains, each with a nominal capacity of 0.7 Bcf/d and peak capacity of 0.8 Bcf/d, bringing the facility’s total nominal export capacity to 2.0 Bcf/d once fully operational. Upon completion, Golden Pass LNG is expected to become the third-largest LNG export facility in the United States by nominal capacity, behind Sabine Pass LNG and Plaquemines LNG. Train 2 is expected to begin operations in the second half of 2026, with Train 3 anticipated to come online during the first half of 2027.
Production & Supply
Natural gas production across the U.S. Lower 48 states has remained relatively steady so far in May, averaging 109.6 billion cubic feet per day (Bcf/d), unchanged from April levels. This remains slightly below the record monthly average of 110.6 Bcf/d reached in December 2025. Production has softened in recent weeks as persistently low spot prices have prompted some producers, including EQT Corporation, to scale back output while waiting for stronger market pricing.
Pricing pressure has been most pronounced at the Waha Hub in West Texas, where natural gas prices have remained in negative territory for a record 66 consecutive days. These negative prices are being driven primarily by ongoing pipeline and infrastructure constraints in the Permian Basin, which limit the ability to move excess supply out of the region. As a result, growing associated gas production continues to overwhelm available takeaway capacity, forcing prices lower to incentivize curtailments. Negative daily Waha pricing first emerged in 2019 and has become increasingly common in recent years, underscoring the growing mismatch between supply growth and midstream infrastructure. Year‑to‑date in 2026, Waha prices have averaged negative $2.29/MMBtu, compared with a positive $1.15/MMBtu in 2025 and a five‑year average of positive $2.88/MMBtu from 2021 through 2025.
On the storage front, the U.S. Energy Information Administration (EIA) estimated working gas inventories at 2,205 Bcf as of May 1, 2026, reflecting a 63 Bcf injection from the previous week. Storage levels currently stand 75 Bcf above year-ago levels and 139 Bcf higher than the five-year average of 2,066 Bcf, keeping inventories comfortably within the historical five-year range.
Looking ahead, the combination of developing El Niño conditions and the approaching Atlantic hurricane season will remain key market focus areas. While El Niño patterns typically suppress Atlantic hurricane activity, tropical systems still pose risks to Gulf Coast oil and natural gas production, LNG export operations, and regional power demand. Together, these weather-driven factors are likely to play a central role in shaping market dynamics as summer unfolds.
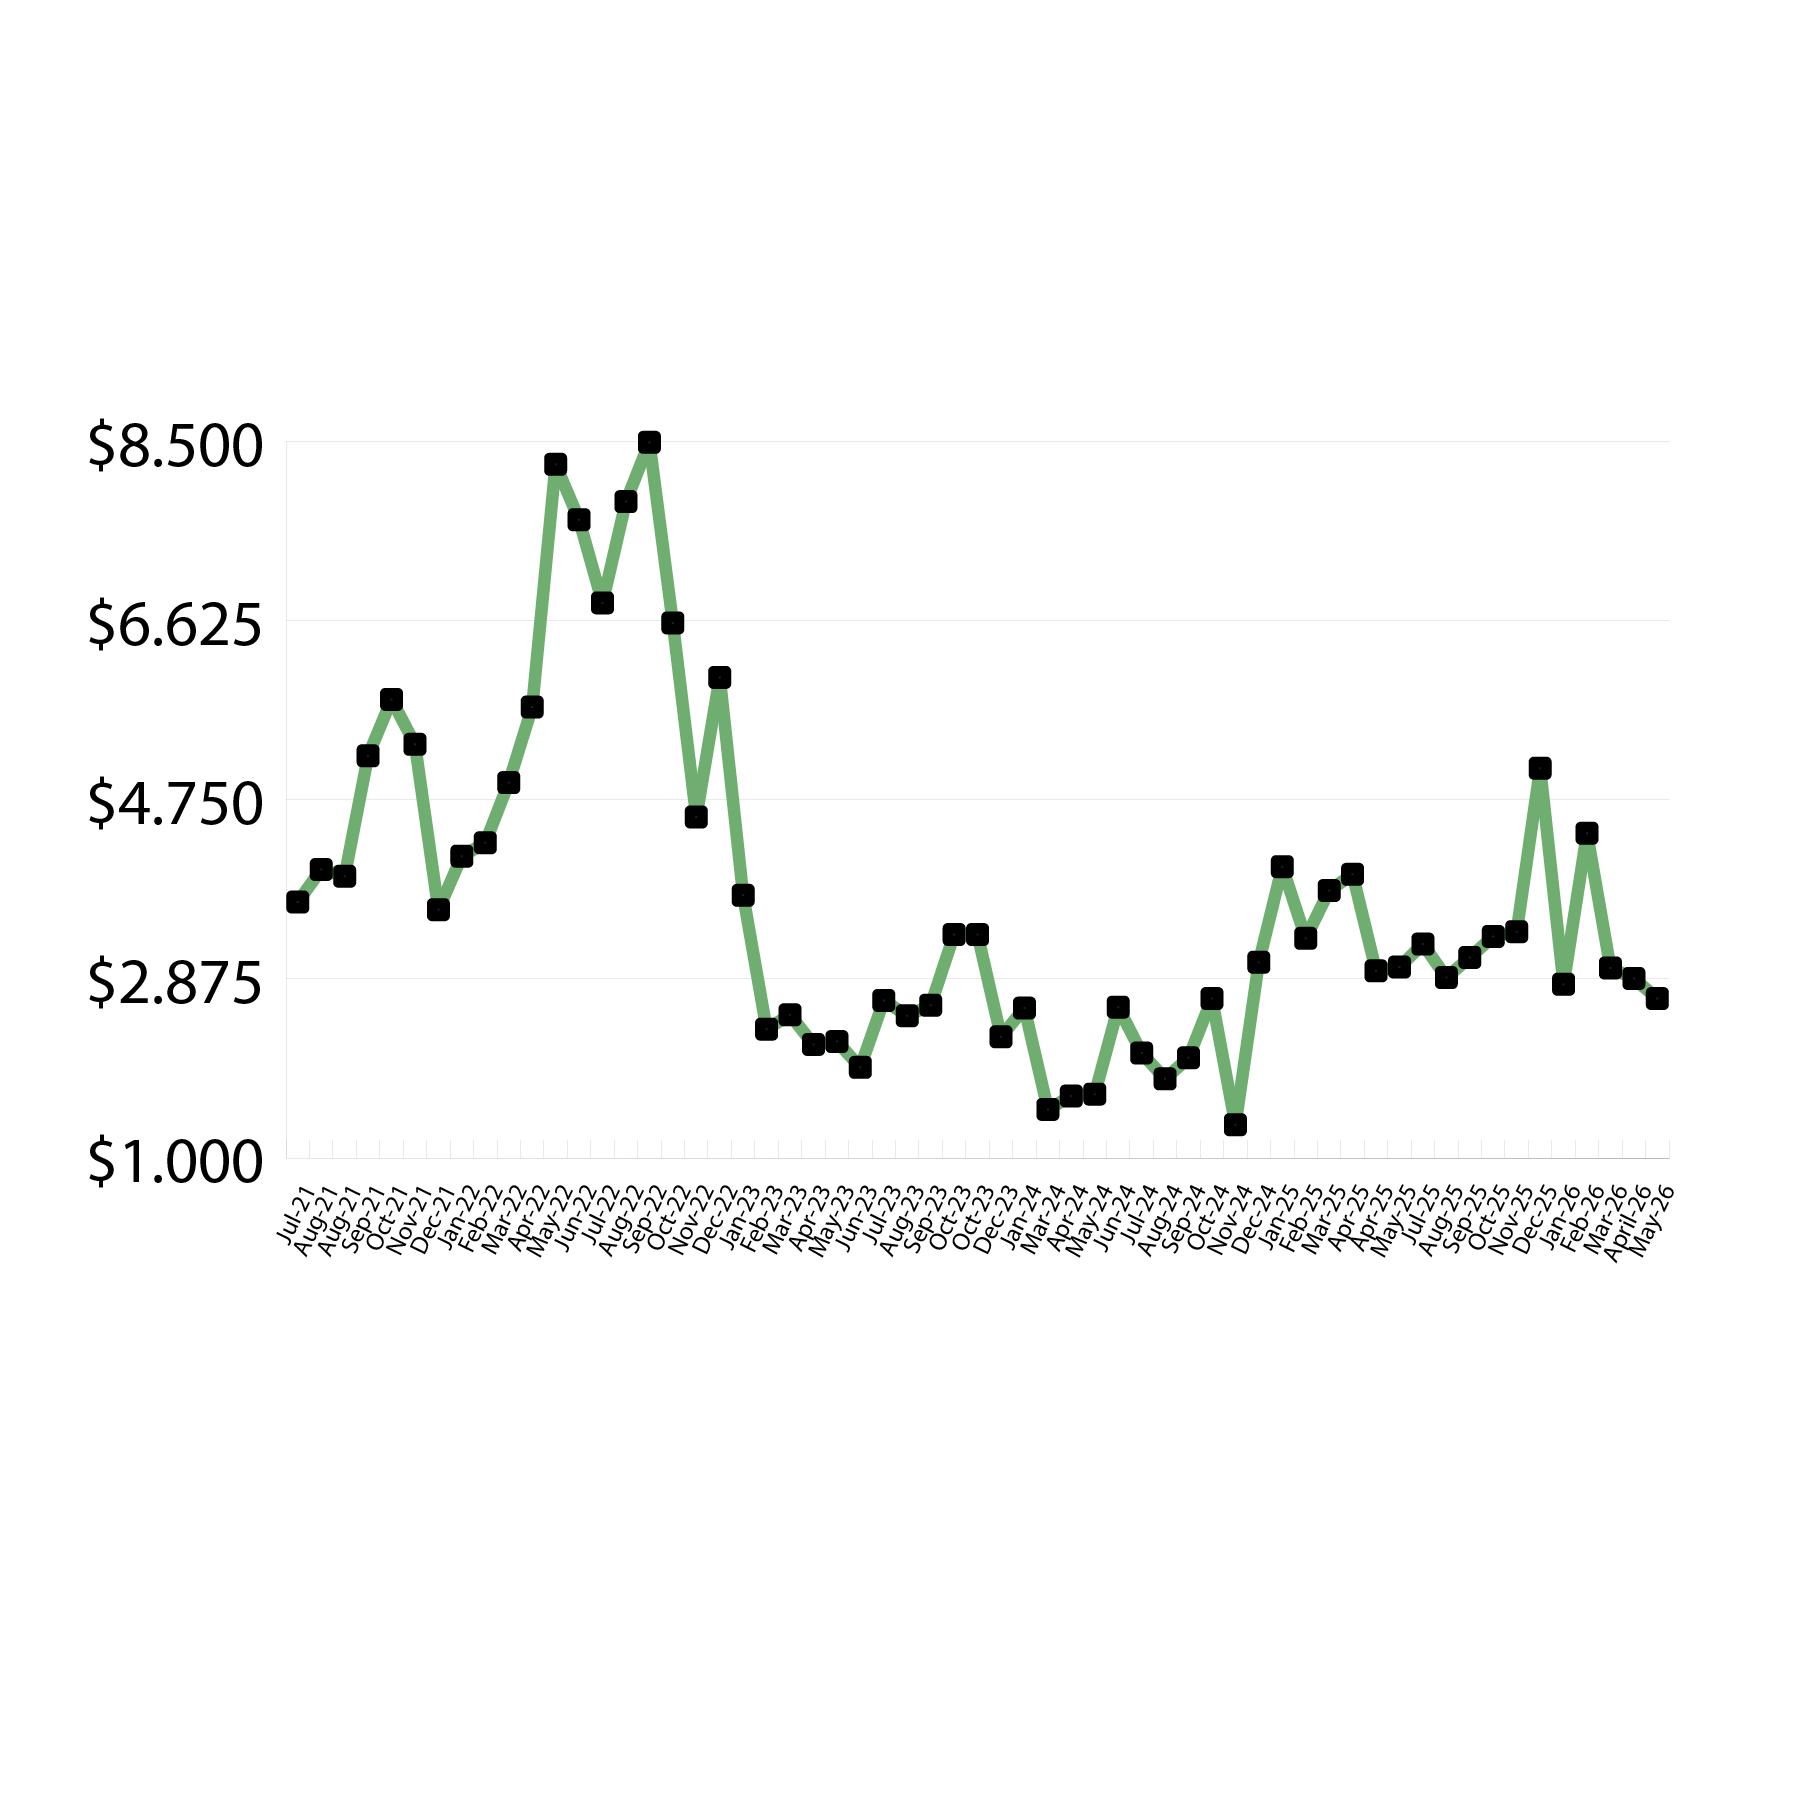
Market Data:
May 13, 2026

May 2026 – Energy News
May 13, 2026
The spring shoulder season is drawing to a close, with power demand tied to air conditioning expected to build later this month and strengthen into June. Early forecasts pointing to one of the hottest summers on record are already shaping market expectations. Meanwhile, persistent geopolitical tensions in the Middle East continue to underpin natural gas prices, with U.S. LNG exports running near capacity.
Domestic Demand
Although much of the U.S. experienced warmer-than-normal temperatures earlier this spring, cooler weather at the start of this month helped maintain natural gas demand. The most significant change in U.S. fundamentals on Monday was a 2,115 MMcf/d increase in residential and commercial demand, driven primarily by gains in the Midcontinent and Northeast regions, which rose by 1,122 MMcf/d and 965 MMcf/d, respectively.
Looking ahead to this summer, the National Oceanic and Atmospheric Administration (NOAA) is forecasting the development of a strong El Niño weather pattern. Some meteorologists are referring to the potential event as a “super” El Niño, which could bring record-setting temperatures and increase natural gas demand for electricity generation as cooling needs rise across the country.
International Demand
International LNG demand remains elevated as global markets continue to respond to supply disruptions tied to the ongoing conflict involving Iran. Tensions surrounding the Strait of Hormuz have significantly impacted global energy flows, with nearly 20 percent of the world’s LNG supply affected by disruptions to one of the most critical energy transit routes in the world.
At the same time, new U.S. LNG export capacity continues to come online. On April 22, 2026, Golden Pass LNG shipped its first LNG cargo from Train 1, just 23 days after achieving first LNG production in March. Golden Pass is currently the only new U.S. LNG export facility expected to begin shipments in 2026, further highlighting the importance of U.S. LNG exports in helping offset tightening global supply conditions.
The project includes three liquefaction trains, each with a nominal capacity of 0.7 Bcf/d and peak capacity of 0.8 Bcf/d, bringing the facility’s total nominal export capacity to 2.0 Bcf/d once fully operational. Upon completion, Golden Pass LNG is expected to become the third-largest LNG export facility in the United States by nominal capacity, behind Sabine Pass LNG and Plaquemines LNG. Train 2 is expected to begin operations in the second half of 2026, with Train 3 anticipated to come online during the first half of 2027.
Production & Supply
Natural gas production across the U.S. Lower 48 states has remained relatively steady so far in May, averaging 109.6 billion cubic feet per day (Bcf/d), unchanged from April levels. This remains slightly below the record monthly average of 110.6 Bcf/d reached in December 2025. Production has softened in recent weeks as persistently low spot prices have prompted some producers, including EQT Corporation, to scale back output while waiting for stronger market pricing.
Pricing pressure has been most pronounced at the Waha Hub in West Texas, where natural gas prices have remained in negative territory for a record 66 consecutive days. These negative prices are being driven primarily by ongoing pipeline and infrastructure constraints in the Permian Basin, which limit the ability to move excess supply out of the region. As a result, growing associated gas production continues to overwhelm available takeaway capacity, forcing prices lower to incentivize curtailments. Negative daily Waha pricing first emerged in 2019 and has become increasingly common in recent years, underscoring the growing mismatch between supply growth and midstream infrastructure. Year‑to‑date in 2026, Waha prices have averaged negative $2.29/MMBtu, compared with a positive $1.15/MMBtu in 2025 and a five‑year average of positive $2.88/MMBtu from 2021 through 2025.
On the storage front, the U.S. Energy Information Administration (EIA) estimated working gas inventories at 2,205 Bcf as of May 1, 2026, reflecting a 63 Bcf injection from the previous week. Storage levels currently stand 75 Bcf above year-ago levels and 139 Bcf higher than the five-year average of 2,066 Bcf, keeping inventories comfortably within the historical five-year range.
Looking ahead, the combination of developing El Niño conditions and the approaching Atlantic hurricane season will remain key market focus areas. While El Niño patterns typically suppress Atlantic hurricane activity, tropical systems still pose risks to Gulf Coast oil and natural gas production, LNG export operations, and regional power demand. Together, these weather-driven factors are likely to play a central role in shaping market dynamics as summer unfolds.
Market Data:
May 13, 2026
May 13, 2026
May 2026 – Energy News
The spring shoulder season is drawing to a close, with power demand tied to air conditioning expected to build later this month and strengthen into June. Early forecasts pointing to one of the hottest summers on record are already shaping market expectations. Meanwhile, persistent geopolitical tensions in the Middle East continue to underpin natural gas prices, with U.S. LNG exports running near capacity.
Domestic Demand
Although much of the U.S. experienced warmer-than-normal temperatures earlier this spring, cooler weather at the start of this month helped maintain natural gas demand. The most significant change in U.S. fundamentals on Monday was a 2,115 MMcf/d increase in residential and commercial demand, driven primarily by gains in the Midcontinent and Northeast regions, which rose by 1,122 MMcf/d and 965 MMcf/d, respectively.
Looking ahead to this summer, the National Oceanic and Atmospheric Administration (NOAA) is forecasting the development of a strong El Niño weather pattern. Some meteorologists are referring to the potential event as a “super” El Niño, which could bring record-setting temperatures and increase natural gas demand for electricity generation as cooling needs rise across the country.
International Demand
International LNG demand remains elevated as global markets continue to respond to supply disruptions tied to the ongoing conflict involving Iran. Tensions surrounding the Strait of Hormuz have significantly impacted global energy flows, with nearly 20 percent of the world’s LNG supply affected by disruptions to one of the most critical energy transit routes in the world.
At the same time, new U.S. LNG export capacity continues to come online. On April 22, 2026, Golden Pass LNG shipped its first LNG cargo from Train 1, just 23 days after achieving first LNG production in March. Golden Pass is currently the only new U.S. LNG export facility expected to begin shipments in 2026, further highlighting the importance of U.S. LNG exports in helping offset tightening global supply conditions.
The project includes three liquefaction trains, each with a nominal capacity of 0.7 Bcf/d and peak capacity of 0.8 Bcf/d, bringing the facility’s total nominal export capacity to 2.0 Bcf/d once fully operational. Upon completion, Golden Pass LNG is expected to become the third-largest LNG export facility in the United States by nominal capacity, behind Sabine Pass LNG and Plaquemines LNG. Train 2 is expected to begin operations in the second half of 2026, with Train 3 anticipated to come online during the first half of 2027.
Production & Supply
Natural gas production across the U.S. Lower 48 states has remained relatively steady so far in May, averaging 109.6 billion cubic feet per day (Bcf/d), unchanged from April levels. This remains slightly below the record monthly average of 110.6 Bcf/d reached in December 2025. Production has softened in recent weeks as persistently low spot prices have prompted some producers, including EQT Corporation, to scale back output while waiting for stronger market pricing.
Pricing pressure has been most pronounced at the Waha Hub in West Texas, where natural gas prices have remained in negative territory for a record 66 consecutive days. These negative prices are being driven primarily by ongoing pipeline and infrastructure constraints in the Permian Basin, which limit the ability to move excess supply out of the region. As a result, growing associated gas production continues to overwhelm available takeaway capacity, forcing prices lower to incentivize curtailments. Negative daily Waha pricing first emerged in 2019 and has become increasingly common in recent years, underscoring the growing mismatch between supply growth and midstream infrastructure. Year‑to‑date in 2026, Waha prices have averaged negative $2.29/MMBtu, compared with a positive $1.15/MMBtu in 2025 and a five‑year average of positive $2.88/MMBtu from 2021 through 2025.
On the storage front, the U.S. Energy Information Administration (EIA) estimated working gas inventories at 2,205 Bcf as of May 1, 2026, reflecting a 63 Bcf injection from the previous week. Storage levels currently stand 75 Bcf above year-ago levels and 139 Bcf higher than the five-year average of 2,066 Bcf, keeping inventories comfortably within the historical five-year range.
Looking ahead, the combination of developing El Niño conditions and the approaching Atlantic hurricane season will remain key market focus areas. While El Niño patterns typically suppress Atlantic hurricane activity, tropical systems still pose risks to Gulf Coast oil and natural gas production, LNG export operations, and regional power demand. Together, these weather-driven factors are likely to play a central role in shaping market dynamics as summer unfolds.

May 13, 2026
The spring shoulder season is drawing to a close, with power demand tied to air conditioning expected to build later this month and strengthen into June. Early forecasts pointing to one of the hottest summers on record are already shaping market expectations. Meanwhile, persistent geopolitical tensions in the Middle East continue to underpin natural gas prices, with U.S. LNG exports running near capacity.
Domestic Demand
Although much of the U.S. experienced warmer-than-normal temperatures earlier this spring, cooler weather at the start of this month helped maintain natural gas demand. The most significant change in U.S. fundamentals on Monday was a 2,115 MMcf/d increase in residential and commercial demand, driven primarily by gains in the Midcontinent and Northeast regions, which rose by 1,122 MMcf/d and 965 MMcf/d, respectively.
Looking ahead to this summer, the National Oceanic and Atmospheric Administration (NOAA) is forecasting the development of a strong El Niño weather pattern. Some meteorologists are referring to the potential event as a “super” El Niño, which could bring record-setting temperatures and increase natural gas demand for electricity generation as cooling needs rise across the country.
International Demand
International LNG demand remains elevated as global markets continue to respond to supply disruptions tied to the ongoing conflict involving Iran. Tensions surrounding the Strait of Hormuz have significantly impacted global energy flows, with nearly 20 percent of the world’s LNG supply affected by disruptions to one of the most critical energy transit routes in the world.
At the same time, new U.S. LNG export capacity continues to come online. On April 22, 2026, Golden Pass LNG shipped its first LNG cargo from Train 1, just 23 days after achieving first LNG production in March. Golden Pass is currently the only new U.S. LNG export facility expected to begin shipments in 2026, further highlighting the importance of U.S. LNG exports in helping offset tightening global supply conditions.
The project includes three liquefaction trains, each with a nominal capacity of 0.7 Bcf/d and peak capacity of 0.8 Bcf/d, bringing the facility’s total nominal export capacity to 2.0 Bcf/d once fully operational. Upon completion, Golden Pass LNG is expected to become the third-largest LNG export facility in the United States by nominal capacity, behind Sabine Pass LNG and Plaquemines LNG. Train 2 is expected to begin operations in the second half of 2026, with Train 3 anticipated to come online during the first half of 2027.
Production & Supply
Natural gas production across the U.S. Lower 48 states has remained relatively steady so far in May, averaging 109.6 billion cubic feet per day (Bcf/d), unchanged from April levels. This remains slightly below the record monthly average of 110.6 Bcf/d reached in December 2025. Production has softened in recent weeks as persistently low spot prices have prompted some producers, including EQT Corporation, to scale back output while waiting for stronger market pricing.
Pricing pressure has been most pronounced at the Waha Hub in West Texas, where natural gas prices have remained in negative territory for a record 66 consecutive days. These negative prices are being driven primarily by ongoing pipeline and infrastructure constraints in the Permian Basin, which limit the ability to move excess supply out of the region. As a result, growing associated gas production continues to overwhelm available takeaway capacity, forcing prices lower to incentivize curtailments. Negative daily Waha pricing first emerged in 2019 and has become increasingly common in recent years, underscoring the growing mismatch between supply growth and midstream infrastructure. Year‑to‑date in 2026, Waha prices have averaged negative $2.29/MMBtu, compared with a positive $1.15/MMBtu in 2025 and a five‑year average of positive $2.88/MMBtu from 2021 through 2025.
On the storage front, the U.S. Energy Information Administration (EIA) estimated working gas inventories at 2,205 Bcf as of May 1, 2026, reflecting a 63 Bcf injection from the previous week. Storage levels currently stand 75 Bcf above year-ago levels and 139 Bcf higher than the five-year average of 2,066 Bcf, keeping inventories comfortably within the historical five-year range.
Looking ahead, the combination of developing El Niño conditions and the approaching Atlantic hurricane season will remain key market focus areas. While El Niño patterns typically suppress Atlantic hurricane activity, tropical systems still pose risks to Gulf Coast oil and natural gas production, LNG export operations, and regional power demand. Together, these weather-driven factors are likely to play a central role in shaping market dynamics as summer unfolds.
May 13, 2026
May 2026 – Energy News
The spring shoulder season is drawing to a close, with power demand tied to air conditioning expected to build later this month and strengthen into June. Early forecasts pointing to one of the hottest summers on record are already shaping market expectations. Meanwhile, persistent geopolitical tensions in the Middle East continue to underpin natural gas prices, with U.S. LNG exports running near capacity.
Domestic Demand
Although much of the U.S. experienced warmer-than-normal temperatures earlier this spring, cooler weather at the start of this month helped maintain natural gas demand. The most significant change in U.S. fundamentals on Monday was a 2,115 MMcf/d increase in residential and commercial demand, driven primarily by gains in the Midcontinent and Northeast regions, which rose by 1,122 MMcf/d and 965 MMcf/d, respectively.
Looking ahead to this summer, the National Oceanic and Atmospheric Administration (NOAA) is forecasting the development of a strong El Niño weather pattern. Some meteorologists are referring to the potential event as a “super” El Niño, which could bring record-setting temperatures and increase natural gas demand for electricity generation as cooling needs rise across the country.
International Demand
International LNG demand remains elevated as global markets continue to respond to supply disruptions tied to the ongoing conflict involving Iran. Tensions surrounding the Strait of Hormuz have significantly impacted global energy flows, with nearly 20 percent of the world’s LNG supply affected by disruptions to one of the most critical energy transit routes in the world.
At the same time, new U.S. LNG export capacity continues to come online. On April 22, 2026, Golden Pass LNG shipped its first LNG cargo from Train 1, just 23 days after achieving first LNG production in March. Golden Pass is currently the only new U.S. LNG export facility expected to begin shipments in 2026, further highlighting the importance of U.S. LNG exports in helping offset tightening global supply conditions.
The project includes three liquefaction trains, each with a nominal capacity of 0.7 Bcf/d and peak capacity of 0.8 Bcf/d, bringing the facility’s total nominal export capacity to 2.0 Bcf/d once fully operational. Upon completion, Golden Pass LNG is expected to become the third-largest LNG export facility in the United States by nominal capacity, behind Sabine Pass LNG and Plaquemines LNG. Train 2 is expected to begin operations in the second half of 2026, with Train 3 anticipated to come online during the first half of 2027.
Production & Supply
Natural gas production across the U.S. Lower 48 states has remained relatively steady so far in May, averaging 109.6 billion cubic feet per day (Bcf/d), unchanged from April levels. This remains slightly below the record monthly average of 110.6 Bcf/d reached in December 2025. Production has softened in recent weeks as persistently low spot prices have prompted some producers, including EQT Corporation, to scale back output while waiting for stronger market pricing.
Pricing pressure has been most pronounced at the Waha Hub in West Texas, where natural gas prices have remained in negative territory for a record 66 consecutive days. These negative prices are being driven primarily by ongoing pipeline and infrastructure constraints in the Permian Basin, which limit the ability to move excess supply out of the region. As a result, growing associated gas production continues to overwhelm available takeaway capacity, forcing prices lower to incentivize curtailments. Negative daily Waha pricing first emerged in 2019 and has become increasingly common in recent years, underscoring the growing mismatch between supply growth and midstream infrastructure. Year‑to‑date in 2026, Waha prices have averaged negative $2.29/MMBtu, compared with a positive $1.15/MMBtu in 2025 and a five‑year average of positive $2.88/MMBtu from 2021 through 2025.
On the storage front, the U.S. Energy Information Administration (EIA) estimated working gas inventories at 2,205 Bcf as of May 1, 2026, reflecting a 63 Bcf injection from the previous week. Storage levels currently stand 75 Bcf above year-ago levels and 139 Bcf higher than the five-year average of 2,066 Bcf, keeping inventories comfortably within the historical five-year range.
Looking ahead, the combination of developing El Niño conditions and the approaching Atlantic hurricane season will remain key market focus areas. While El Niño patterns typically suppress Atlantic hurricane activity, tropical systems still pose risks to Gulf Coast oil and natural gas production, LNG export operations, and regional power demand. Together, these weather-driven factors are likely to play a central role in shaping market dynamics as summer unfolds.
Make Your Choice Gas Selection in Three Easy Steps
Click here to access our online tool, or call our Choice gas commodity experts at 1 (877) 790-4990.
Step 1: Enter your account number
- Your Black Hills Energy account number is located at the top right-hand corner of your bill.
Step 2: Review price options and make your selection
Step 3: Confirm your selection and enter your control number
- You received a control number in your 2026 Choice Gas selection packet mailed to you from Black Hills Energy. If you cannot locate this, you can retrieve your control number by calling 877-245-3506 or visit choicegas.com
Once enrolled, you will be removed from supplier marketing communications within 24 hours.


Sign Up for Our Energy Newsletters
Sign Up