February 11, 2026
February 2026 – Energy News
The end of January brought one of the most significant winter storms in recent U.S. history, pushing below-normal temperatures, ice, and snowfall from Canada down into northern Mexico.
Named Winter Storm Fern, the event dramatically increased demand for space heating and natural gas, contributing to an unprecedented drawdown in storage levels. According to the Energy Information Administration (EIA), working natural gas stocks in the Lower 48 states fell by 360 billion cubic feet (Bcf) for the week ending January 30, 2026 — the largest weekly net withdrawal on record in the history of the EIA’s Weekly Natural Gas Storage Report.

Domestic Demand
Overall, natural gas demand jumped nearly 10 percent at 138.72 billion cubic feet per day (Bcf/d). The largest driver of this increase was the residential and commercial sectors, which rose 20 percent to 47 Bcf/d.
The weather continues to be the primary driver of short-term demand shifts and market volatility. Looking forward, the EIA’s latest Short-Term Energy Outlook indicates that total U.S. natural gas consumption is forecast to remain relatively flat over the next two years. According to the report, “decreases in consumption in the industrial, commercial, and residential sectors are offset by increases in consumption in the electric power sector,” as natural gas continues to play a key role in electricity generation and balancing variable renewable energy.
International Demand
The U.S. was not the only region affected by colder-than-normal temperatures last month. In Europe, January’s cold weather increased heating and power demand, driving natural gas prices up by 38 percent. While prices eased toward the end of the month, European storage levels finished January at just 44 percent of total capacity—well below the 10-year average of 58 percent. To help meet rising demand, U.S. liquefied natural gas (LNG) accounted for nearly 60 percent of Europe’s natural gas supply during January.
Production & Supply
As of Friday, January 30, U.S. natural gas storage stood at 2,463 Bcf, a decline of 12.75 percent from the prior week. While inventories remain 1.7 percent higher than this time last year, they are still 1.1 percent below the five-year average. Winter Storm Fern also contributed to the largest weekly storage withdrawal ever recorded in the U.S.
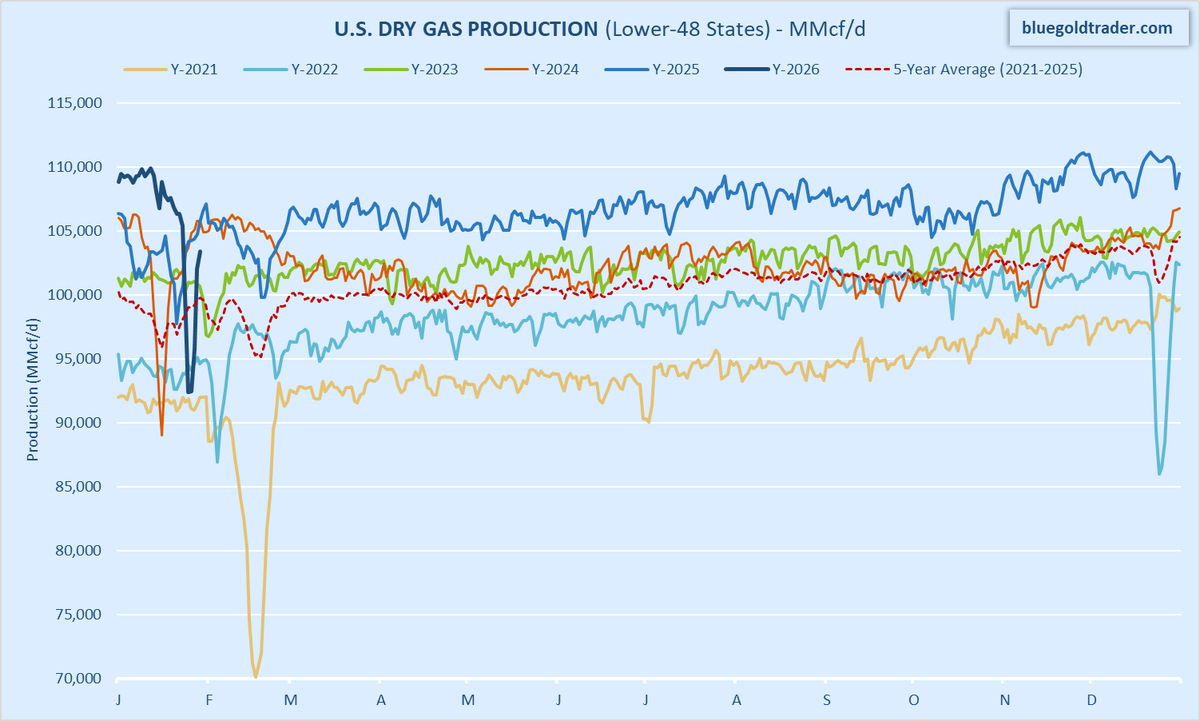
On the supply side, the U.S. had 122 active natural gas rigs as of January 13, representing a 24.5 percent increase compared with the same period last year. Total U.S. natural gas supply reached 115.9 Bcf/d, up from 109.23 Bcf/d one year earlier.
Winter Storm Fern affected more than just demand. At the height of the storm, an estimated 17 percent of U.S. natural gas production was curtailed due to freeze-offs. These production disruptions contributed to the record storage withdrawal and underscore the ongoing risks that extreme cold poses to natural gas supply.
Market Data:
February 11, 2026

February 2026 – Energy News
February 11, 2026
The end of January brought one of the most significant winter storms in recent U.S. history, pushing below-normal temperatures, ice, and snowfall from Canada down into northern Mexico.
Named Winter Storm Fern, the event dramatically increased demand for space heating and natural gas, contributing to an unprecedented drawdown in storage levels. According to the Energy Information Administration (EIA), working natural gas stocks in the Lower 48 states fell by 360 billion cubic feet (Bcf) for the week ending January 30, 2026 — the largest weekly net withdrawal on record in the history of the EIA’s Weekly Natural Gas Storage Report.
Domestic Demand
Overall, natural gas demand jumped nearly 10 percent at 138.72 billion cubic feet per day (Bcf/d). The largest driver of this increase was the residential and commercial sectors, which rose 20 percent to 47 Bcf/d.
The weather continues to be the primary driver of short-term demand shifts and market volatility. Looking forward, the EIA’s latest Short-Term Energy Outlook indicates that total U.S. natural gas consumption is forecast to remain relatively flat over the next two years. According to the report, “decreases in consumption in the industrial, commercial, and residential sectors are offset by increases in consumption in the electric power sector,” as natural gas continues to play a key role in electricity generation and balancing variable renewable energy.
International Demand
The U.S. was not the only region affected by colder-than-normal temperatures last month. In Europe, January’s cold weather increased heating and power demand, driving natural gas prices up by 38 percent. While prices eased toward the end of the month, European storage levels finished January at just 44 percent of total capacity—well below the 10-year average of 58 percent. To help meet rising demand, U.S. liquefied natural gas (LNG) accounted for nearly 60 percent of Europe’s natural gas supply during January.
Production & Supply
As of Friday, January 30, U.S. natural gas storage stood at 2,463 Bcf, a decline of 12.75 percent from the prior week. While inventories remain 1.7 percent higher than this time last year, they are still 1.1 percent below the five-year average. Winter Storm Fern also contributed to the largest weekly storage withdrawal ever recorded in the U.S.
On the supply side, the U.S. had 122 active natural gas rigs as of January 13, representing a 24.5 percent increase compared with the same period last year. Total U.S. natural gas supply reached 115.9 Bcf/d, up from 109.23 Bcf/d one year earlier.
Winter Storm Fern affected more than just demand. At the height of the storm, an estimated 17 percent of U.S. natural gas production was curtailed due to freeze-offs. These production disruptions contributed to the record storage withdrawal and underscore the ongoing risks that extreme cold poses to natural gas supply.
Market Data:
February 11, 2026
February 11, 2026
February 2026 – Energy News
The end of January brought one of the most significant winter storms in recent U.S. history, pushing below-normal temperatures, ice, and snowfall from Canada down into northern Mexico.
Named Winter Storm Fern, the event dramatically increased demand for space heating and natural gas, contributing to an unprecedented drawdown in storage levels. According to the Energy Information Administration (EIA), working natural gas stocks in the Lower 48 states fell by 360 billion cubic feet (Bcf) for the week ending January 30, 2026 — the largest weekly net withdrawal on record in the history of the EIA’s Weekly Natural Gas Storage Report.
Domestic Demand
Overall, natural gas demand jumped nearly 10 percent at 138.72 billion cubic feet per day (Bcf/d). The largest driver of this increase was the residential and commercial sectors, which rose 20 percent to 47 Bcf/d.
The weather continues to be the primary driver of short-term demand shifts and market volatility. Looking forward, the EIA’s latest Short-Term Energy Outlook indicates that total U.S. natural gas consumption is forecast to remain relatively flat over the next two years. According to the report, “decreases in consumption in the industrial, commercial, and residential sectors are offset by increases in consumption in the electric power sector,” as natural gas continues to play a key role in electricity generation and balancing variable renewable energy.
International Demand
The U.S. was not the only region affected by colder-than-normal temperatures last month. In Europe, January’s cold weather increased heating and power demand, driving natural gas prices up by 38 percent. While prices eased toward the end of the month, European storage levels finished January at just 44 percent of total capacity—well below the 10-year average of 58 percent. To help meet rising demand, U.S. liquefied natural gas (LNG) accounted for nearly 60 percent of Europe’s natural gas supply during January.
Production & Supply
As of Friday, January 30, U.S. natural gas storage stood at 2,463 Bcf, a decline of 12.75 percent from the prior week. While inventories remain 1.7 percent higher than this time last year, they are still 1.1 percent below the five-year average. Winter Storm Fern also contributed to the largest weekly storage withdrawal ever recorded in the U.S.
On the supply side, the U.S. had 122 active natural gas rigs as of January 13, representing a 24.5 percent increase compared with the same period last year. Total U.S. natural gas supply reached 115.9 Bcf/d, up from 109.23 Bcf/d one year earlier.
Winter Storm Fern affected more than just demand. At the height of the storm, an estimated 17 percent of U.S. natural gas production was curtailed due to freeze-offs. These production disruptions contributed to the record storage withdrawal and underscore the ongoing risks that extreme cold poses to natural gas supply.

February 11, 2026
The end of January brought one of the most significant winter storms in recent U.S. history, pushing below-normal temperatures, ice, and snowfall from Canada down into northern Mexico.
Named Winter Storm Fern, the event dramatically increased demand for space heating and natural gas, contributing to an unprecedented drawdown in storage levels. According to the Energy Information Administration (EIA), working natural gas stocks in the Lower 48 states fell by 360 billion cubic feet (Bcf) for the week ending January 30, 2026 — the largest weekly net withdrawal on record in the history of the EIA’s Weekly Natural Gas Storage Report.
Domestic Demand
Overall, natural gas demand jumped nearly 10 percent at 138.72 billion cubic feet per day (Bcf/d). The largest driver of this increase was the residential and commercial sectors, which rose 20 percent to 47 Bcf/d.
The weather continues to be the primary driver of short-term demand shifts and market volatility. Looking forward, the EIA’s latest Short-Term Energy Outlook indicates that total U.S. natural gas consumption is forecast to remain relatively flat over the next two years. According to the report, “decreases in consumption in the industrial, commercial, and residential sectors are offset by increases in consumption in the electric power sector,” as natural gas continues to play a key role in electricity generation and balancing variable renewable energy.
International Demand
The U.S. was not the only region affected by colder-than-normal temperatures last month. In Europe, January’s cold weather increased heating and power demand, driving natural gas prices up by 38 percent. While prices eased toward the end of the month, European storage levels finished January at just 44 percent of total capacity—well below the 10-year average of 58 percent. To help meet rising demand, U.S. liquefied natural gas (LNG) accounted for nearly 60 percent of Europe’s natural gas supply during January.
Production & Supply
As of Friday, January 30, U.S. natural gas storage stood at 2,463 Bcf, a decline of 12.75 percent from the prior week. While inventories remain 1.7 percent higher than this time last year, they are still 1.1 percent below the five-year average. Winter Storm Fern also contributed to the largest weekly storage withdrawal ever recorded in the U.S.
On the supply side, the U.S. had 122 active natural gas rigs as of January 13, representing a 24.5 percent increase compared with the same period last year. Total U.S. natural gas supply reached 115.9 Bcf/d, up from 109.23 Bcf/d one year earlier.
Winter Storm Fern affected more than just demand. At the height of the storm, an estimated 17 percent of U.S. natural gas production was curtailed due to freeze-offs. These production disruptions contributed to the record storage withdrawal and underscore the ongoing risks that extreme cold poses to natural gas supply.
February 11, 2026
February 2026 – Energy News
The end of January brought one of the most significant winter storms in recent U.S. history, pushing below-normal temperatures, ice, and snowfall from Canada down into northern Mexico.
Named Winter Storm Fern, the event dramatically increased demand for space heating and natural gas, contributing to an unprecedented drawdown in storage levels. According to the Energy Information Administration (EIA), working natural gas stocks in the Lower 48 states fell by 360 billion cubic feet (Bcf) for the week ending January 30, 2026 — the largest weekly net withdrawal on record in the history of the EIA’s Weekly Natural Gas Storage Report.
Domestic Demand
Overall, natural gas demand jumped nearly 10 percent at 138.72 billion cubic feet per day (Bcf/d). The largest driver of this increase was the residential and commercial sectors, which rose 20 percent to 47 Bcf/d.
The weather continues to be the primary driver of short-term demand shifts and market volatility. Looking forward, the EIA’s latest Short-Term Energy Outlook indicates that total U.S. natural gas consumption is forecast to remain relatively flat over the next two years. According to the report, “decreases in consumption in the industrial, commercial, and residential sectors are offset by increases in consumption in the electric power sector,” as natural gas continues to play a key role in electricity generation and balancing variable renewable energy.
International Demand
The U.S. was not the only region affected by colder-than-normal temperatures last month. In Europe, January’s cold weather increased heating and power demand, driving natural gas prices up by 38 percent. While prices eased toward the end of the month, European storage levels finished January at just 44 percent of total capacity—well below the 10-year average of 58 percent. To help meet rising demand, U.S. liquefied natural gas (LNG) accounted for nearly 60 percent of Europe’s natural gas supply during January.
Production & Supply
As of Friday, January 30, U.S. natural gas storage stood at 2,463 Bcf, a decline of 12.75 percent from the prior week. While inventories remain 1.7 percent higher than this time last year, they are still 1.1 percent below the five-year average. Winter Storm Fern also contributed to the largest weekly storage withdrawal ever recorded in the U.S.
On the supply side, the U.S. had 122 active natural gas rigs as of January 13, representing a 24.5 percent increase compared with the same period last year. Total U.S. natural gas supply reached 115.9 Bcf/d, up from 109.23 Bcf/d one year earlier.
Winter Storm Fern affected more than just demand. At the height of the storm, an estimated 17 percent of U.S. natural gas production was curtailed due to freeze-offs. These production disruptions contributed to the record storage withdrawal and underscore the ongoing risks that extreme cold poses to natural gas supply.
Make Your Choice Gas Selection in Three Easy Steps
Click here to access our online tool, or call our Choice gas commodity experts at 1 (877) 790-4990.
Step 1: Enter your account number
- Your Black Hills Energy account number is located at the top right-hand corner of your bill.
Step 2: Review price options and make your selection
Step 3: Confirm your selection and enter your control number
- You received a control number in your 2026 Choice Gas selection packet mailed to you from Black Hills Energy. If you cannot locate this, you can retrieve your control number by calling 877-245-3506 or visit choicegas.com
Once enrolled, you will be removed from supplier marketing communications within 24 hours.


Sign Up for Our Energy Newsletters
Sign Up