October 14, 2026
October 2026 – Energy News
Market Summary
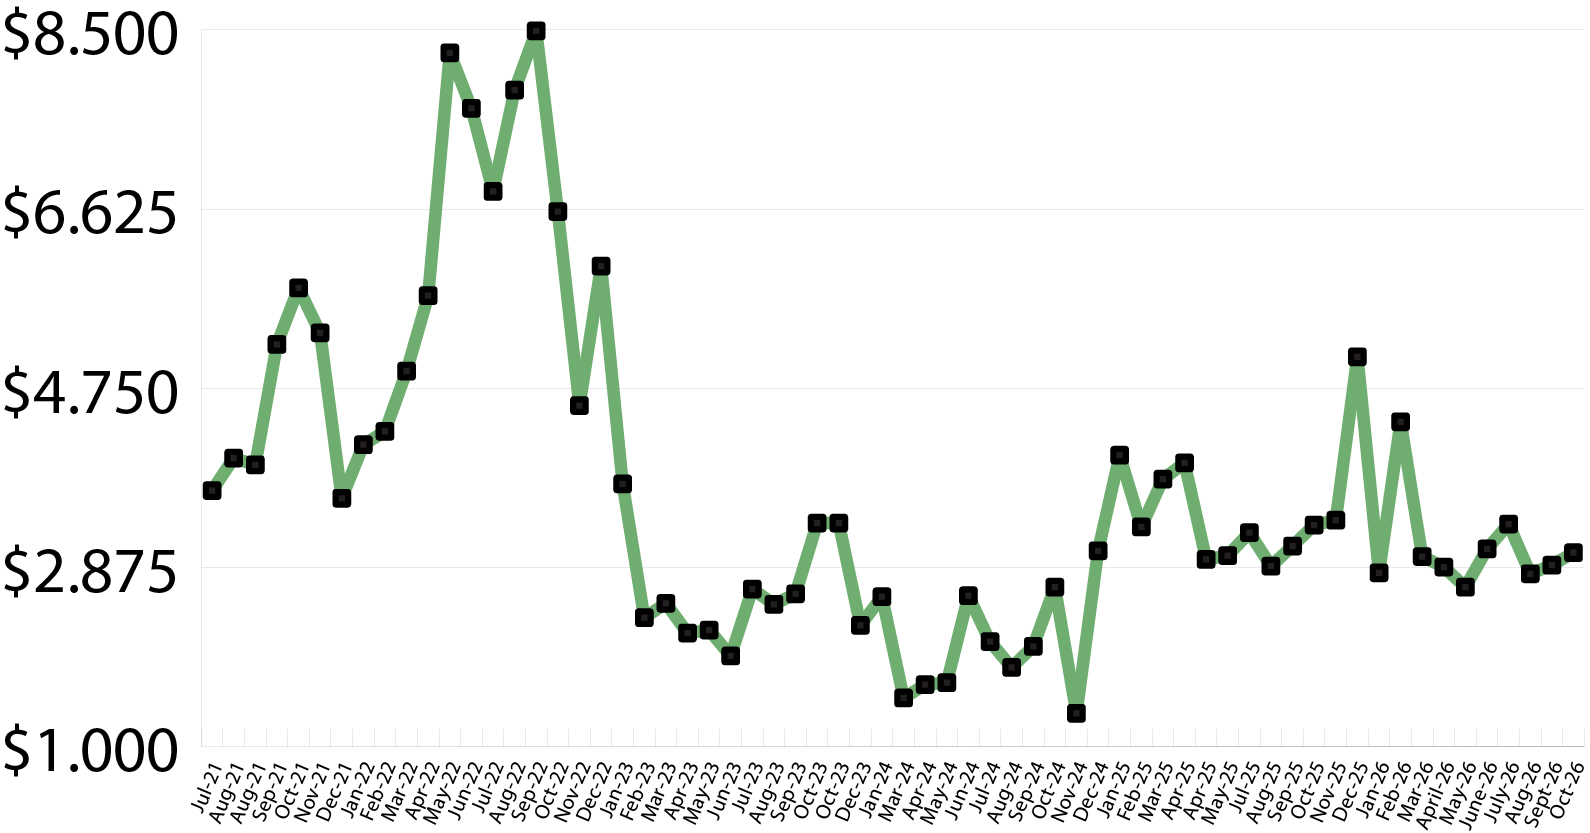
Prices firmed modestly in early October. The November contract hit $3.30/MMBtu as Hurricane Isaias approached the Gulf, then eased to $3.17 by October 12 on milder forecasts. The EIA’s October outlook nudged its 2026 Henry Hub forecast up to $3.48/MMBtu but cut 2027 to $3.16, as production growth is expected to outpace demand. For customers, prices remain moderate heading into winter, and weather is the key variable to watch.
Domestic Demand
Power generation remains the growth story. Natural gas use for electricity was up nearly 5% year over year in September, with data centers a key driver. A mild start to October has kept heating demand light, and the EIA expects households that heat with natural gas to spend less this winter than last.
International Demand
Global LNG markets are tight heading into winter, with Strait of Hormuz shipping still disrupted and European storage at a record low for the season. U.S. LNG feed gas hit a record 18.0 Bcf/d in September, with new capacity at Corpus Christi and Golden Pass still ramping up. Because U.S. terminals are running near capacity, the effect on domestic prices remains limited.
Production & Supply
Production set records in August and September before easing in October, as producers pulled back and Isaias briefly shut in about 59% of offshore Gulf gas output. The EIA expects output to keep growing into 2027, led by the Permian and Haynesville. Storage stood at 3,500 Bcf on October 2 — 2% above the five-year average — a healthy but slightly smaller cushion than projected last month. The wildcard is weather: NOAA says a strong-to-very strong El Niño is more than 83% likely through early 2027, favoring a warmer-than-normal winter across the northern U.S. If that holds, heating demand and prices could come in below the EIA’s forecast.
Market Data:
October 14, 2026

October 2026 – Energy News
October 14, 2026
Market Summary
Prices firmed modestly in early October. The November contract hit $3.30/MMBtu as Hurricane Isaias approached the Gulf, then eased to $3.17 by October 12 on milder forecasts. The EIA’s October outlook nudged its 2026 Henry Hub forecast up to $3.48/MMBtu but cut 2027 to $3.16, as production growth is expected to outpace demand. For customers, prices remain moderate heading into winter, and weather is the key variable to watch.
Domestic Demand
Power generation remains the growth story. Natural gas use for electricity was up nearly 5% year over year in September, with data centers a key driver. A mild start to October has kept heating demand light, and the EIA expects households that heat with natural gas to spend less this winter than last.
International Demand
Global LNG markets are tight heading into winter, with Strait of Hormuz shipping still disrupted and European storage at a record low for the season. U.S. LNG feed gas hit a record 18.0 Bcf/d in September, with new capacity at Corpus Christi and Golden Pass still ramping up. Because U.S. terminals are running near capacity, the effect on domestic prices remains limited.
Production & Supply
Production set records in August and September before easing in October, as producers pulled back and Isaias briefly shut in about 59% of offshore Gulf gas output. The EIA expects output to keep growing into 2027, led by the Permian and Haynesville. Storage stood at 3,500 Bcf on October 2 — 2% above the five-year average — a healthy but slightly smaller cushion than projected last month. The wildcard is weather: NOAA says a strong-to-very strong El Niño is more than 83% likely through early 2027, favoring a warmer-than-normal winter across the northern U.S. If that holds, heating demand and prices could come in below the EIA’s forecast.
Market Data:
October 14, 2026
October 14, 2026
October 2026 – Energy News
Market Summary
Prices firmed modestly in early October. The November contract hit $3.30/MMBtu as Hurricane Isaias approached the Gulf, then eased to $3.17 by October 12 on milder forecasts. The EIA’s October outlook nudged its 2026 Henry Hub forecast up to $3.48/MMBtu but cut 2027 to $3.16, as production growth is expected to outpace demand. For customers, prices remain moderate heading into winter, and weather is the key variable to watch.
Domestic Demand
Power generation remains the growth story. Natural gas use for electricity was up nearly 5% year over year in September, with data centers a key driver. A mild start to October has kept heating demand light, and the EIA expects households that heat with natural gas to spend less this winter than last.
International Demand
Global LNG markets are tight heading into winter, with Strait of Hormuz shipping still disrupted and European storage at a record low for the season. U.S. LNG feed gas hit a record 18.0 Bcf/d in September, with new capacity at Corpus Christi and Golden Pass still ramping up. Because U.S. terminals are running near capacity, the effect on domestic prices remains limited.
Production & Supply
Production set records in August and September before easing in October, as producers pulled back and Isaias briefly shut in about 59% of offshore Gulf gas output. The EIA expects output to keep growing into 2027, led by the Permian and Haynesville. Storage stood at 3,500 Bcf on October 2 — 2% above the five-year average — a healthy but slightly smaller cushion than projected last month. The wildcard is weather: NOAA says a strong-to-very strong El Niño is more than 83% likely through early 2027, favoring a warmer-than-normal winter across the northern U.S. If that holds, heating demand and prices could come in below the EIA’s forecast.
October 14, 2026
October 2026 – Energy News
Market Summary
Prices firmed modestly in early October. The November contract hit $3.30/MMBtu as Hurricane Isaias approached the Gulf, then eased to $3.17 by October 12 on milder forecasts. The EIA’s October outlook nudged its 2026 Henry Hub forecast up to $3.48/MMBtu but cut 2027 to $3.16, as production growth is expected to outpace demand. For customers, prices remain moderate heading into winter, and weather is the key variable to watch.
Domestic Demand
Power generation remains the growth story. Natural gas use for electricity was up nearly 5% year over year in September, with data centers a key driver. A mild start to October has kept heating demand light, and the EIA expects households that heat with natural gas to spend less this winter than last.
International Demand
Global LNG markets are tight heading into winter, with Strait of Hormuz shipping still disrupted and European storage at a record low for the season. U.S. LNG feed gas hit a record 18.0 Bcf/d in September, with new capacity at Corpus Christi and Golden Pass still ramping up. Because U.S. terminals are running near capacity, the effect on domestic prices remains limited.
Production & Supply
Production set records in August and September before easing in October, as producers pulled back and Isaias briefly shut in about 59% of offshore Gulf gas output. The EIA expects output to keep growing into 2027, led by the Permian and Haynesville. Storage stood at 3,500 Bcf on October 2 — 2% above the five-year average — a healthy but slightly smaller cushion than projected last month. The wildcard is weather: NOAA says a strong-to-very strong El Niño is more than 83% likely through early 2027, favoring a warmer-than-normal winter across the northern U.S. If that holds, heating demand and prices could come in below the EIA’s forecast.
October 14, 2026
October 2026 – Energy News
Market Summary
Prices firmed modestly in early October. The November contract hit $3.30/MMBtu as Hurricane Isaias approached the Gulf, then eased to $3.17 by October 12 on milder forecasts. The EIA’s October outlook nudged its 2026 Henry Hub forecast up to $3.48/MMBtu but cut 2027 to $3.16, as production growth is expected to outpace demand. For customers, prices remain moderate heading into winter, and weather is the key variable to watch.
Domestic Demand
Power generation remains the growth story. Natural gas use for electricity was up nearly 5% year over year in September, with data centers a key driver. A mild start to October has kept heating demand light, and the EIA expects households that heat with natural gas to spend less this winter than last.
International Demand
Global LNG markets are tight heading into winter, with Strait of Hormuz shipping still disrupted and European storage at a record low for the season. U.S. LNG feed gas hit a record 18.0 Bcf/d in September, with new capacity at Corpus Christi and Golden Pass still ramping up. Because U.S. terminals are running near capacity, the effect on domestic prices remains limited.
Production & Supply
Production set records in August and September before easing in October, as producers pulled back and Isaias briefly shut in about 59% of offshore Gulf gas output. The EIA expects output to keep growing into 2027, led by the Permian and Haynesville. Storage stood at 3,500 Bcf on October 2 — 2% above the five-year average — a healthy but slightly smaller cushion than projected last month. The wildcard is weather: NOAA says a strong-to-very strong El Niño is more than 83% likely through early 2027, favoring a warmer-than-normal winter across the northern U.S. If that holds, heating demand and prices could come in below the EIA’s forecast.

October 14, 2026
Market Summary
Prices firmed modestly in early October. The November contract hit $3.30/MMBtu as Hurricane Isaias approached the Gulf, then eased to $3.17 by October 12 on milder forecasts. The EIA’s October outlook nudged its 2026 Henry Hub forecast up to $3.48/MMBtu but cut 2027 to $3.16, as production growth is expected to outpace demand. For customers, prices remain moderate heading into winter, and weather is the key variable to watch.
Domestic Demand
Power generation remains the growth story. Natural gas use for electricity was up nearly 5% year over year in September, with data centers a key driver. A mild start to October has kept heating demand light, and the EIA expects households that heat with natural gas to spend less this winter than last.
International Demand
Global LNG markets are tight heading into winter, with Strait of Hormuz shipping still disrupted and European storage at a record low for the season. U.S. LNG feed gas hit a record 18.0 Bcf/d in September, with new capacity at Corpus Christi and Golden Pass still ramping up. Because U.S. terminals are running near capacity, the effect on domestic prices remains limited.
Production & Supply
Production set records in August and September before easing in October, as producers pulled back and Isaias briefly shut in about 59% of offshore Gulf gas output. The EIA expects output to keep growing into 2027, led by the Permian and Haynesville. Storage stood at 3,500 Bcf on October 2 — 2% above the five-year average — a healthy but slightly smaller cushion than projected last month. The wildcard is weather: NOAA says a strong-to-very strong El Niño is more than 83% likely through early 2027, favoring a warmer-than-normal winter across the northern U.S. If that holds, heating demand and prices could come in below the EIA’s forecast.
October 14, 2026
October 2026 – Energy News
Market Summary
Prices firmed modestly in early October. The November contract hit $3.30/MMBtu as Hurricane Isaias approached the Gulf, then eased to $3.17 by October 12 on milder forecasts. The EIA’s October outlook nudged its 2026 Henry Hub forecast up to $3.48/MMBtu but cut 2027 to $3.16, as production growth is expected to outpace demand. For customers, prices remain moderate heading into winter, and weather is the key variable to watch.
Domestic Demand
Power generation remains the growth story. Natural gas use for electricity was up nearly 5% year over year in September, with data centers a key driver. A mild start to October has kept heating demand light, and the EIA expects households that heat with natural gas to spend less this winter than last.
International Demand
Global LNG markets are tight heading into winter, with Strait of Hormuz shipping still disrupted and European storage at a record low for the season. U.S. LNG feed gas hit a record 18.0 Bcf/d in September, with new capacity at Corpus Christi and Golden Pass still ramping up. Because U.S. terminals are running near capacity, the effect on domestic prices remains limited.
Production & Supply
Production set records in August and September before easing in October, as producers pulled back and Isaias briefly shut in about 59% of offshore Gulf gas output. The EIA expects output to keep growing into 2027, led by the Permian and Haynesville. Storage stood at 3,500 Bcf on October 2 — 2% above the five-year average — a healthy but slightly smaller cushion than projected last month. The wildcard is weather: NOAA says a strong-to-very strong El Niño is more than 83% likely through early 2027, favoring a warmer-than-normal winter across the northern U.S. If that holds, heating demand and prices could come in below the EIA’s forecast.
October 14, 2026
October 2026 – Energy News
Market Summary
Prices firmed modestly in early October. The November contract hit $3.30/MMBtu as Hurricane Isaias approached the Gulf, then eased to $3.17 by October 12 on milder forecasts. The EIA’s October outlook nudged its 2026 Henry Hub forecast up to $3.48/MMBtu but cut 2027 to $3.16, as production growth is expected to outpace demand. For customers, prices remain moderate heading into winter, and weather is the key variable to watch.
Domestic Demand
Power generation remains the growth story. Natural gas use for electricity was up nearly 5% year over year in September, with data centers a key driver. A mild start to October has kept heating demand light, and the EIA expects households that heat with natural gas to spend less this winter than last.
International Demand
Global LNG markets are tight heading into winter, with Strait of Hormuz shipping still disrupted and European storage at a record low for the season. U.S. LNG feed gas hit a record 18.0 Bcf/d in September, with new capacity at Corpus Christi and Golden Pass still ramping up. Because U.S. terminals are running near capacity, the effect on domestic prices remains limited.
Production & Supply
Production set records in August and September before easing in October, as producers pulled back and Isaias briefly shut in about 59% of offshore Gulf gas output. The EIA expects output to keep growing into 2027, led by the Permian and Haynesville. Storage stood at 3,500 Bcf on October 2 — 2% above the five-year average — a healthy but slightly smaller cushion than projected last month. The wildcard is weather: NOAA says a strong-to-very strong El Niño is more than 83% likely through early 2027, favoring a warmer-than-normal winter across the northern U.S. If that holds, heating demand and prices could come in below the EIA’s forecast.
Make Your Choice Gas Selection in Three Easy Steps
Click here to access our online tool, or call our Choice gas commodity experts at 1 (877) 790-4990.
Step 1: Enter your account number
- Your Black Hills Energy account number is located at the top right-hand corner of your bill.
Step 2: Review price options and make your selection
Step 3: Confirm your selection and enter your control number
- You received a control number in your 2026 Choice Gas selection packet mailed to you from Black Hills Energy. If you cannot locate this, you can retrieve your control number by calling 877-245-3506 or visit choicegas.com
Once enrolled, you will be removed from supplier marketing communications within 24 hours.


Sign Up for Our Energy Newsletters
Sign UpRecent Posts