
December 10, 2025
December 2025 – Energy News
During Thanksgiving week and early December, a powerful winter storm swept across the U.S., dropping up to a foot of snow in some states. In Minneapolis, temperatures plunged 10 degrees below the historical average.
Domestic Demand
Natural gas demand surged in November as winter weather gripped much of the U.S. Overall consumption, including exports, rose 12.7 percent compared to October and 10.7 percent higher than November 2024. Residential and commercial usage nearly doubled during the first 24 days of November compared to early October and climbed 23.6 percent above the same period last year. Industrial consumption also grew, increasing 5.8 percent from October and 1.6 percent last year.
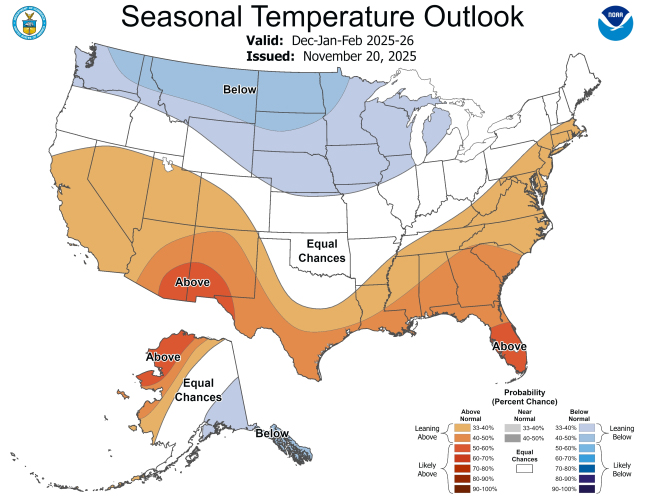
The National Oceanic and Atmospheric Administration (NOAA) has released its long-range forecast for December, January, and February. The forecast predicts below-normal temperatures for the Midwest and the Rocky Mountain region. Extended periods of colder-than-normal temperatures can significantly impact the demand for natural gas.
International Demand
The U.S. strengthened its position as the world’s leading exporter of liquefied natural gas (LNG) in November, setting a record for shipments for the second consecutive month. Colder temperatures abroad and strong output from Cheniere Energy and Venture Global fueled this surge. LNG exports rose from 10.1 million metric tons (mmt) in October to 10.9 mmt in November. Europe received 70 percent of U.S. LNG shipments in November, up from 69 percent in October, highlighting the continent's growing reliance on U.S. LNG.
The European Union (EU) is aiming to eliminate its long-standing dependency on Russian energy by completely phasing out its imports of Russian natural gas by the end of 2027. Meanwhile, Ukraine will begin receiving U.S. LNG through a pipeline across the Balkan Peninsula, with shipments starting from Greece. This agreement aims to help Ukraine meet winter energy needs amid infrastructure damage.
Production & Supply
The U.S. ended November with 3,923 billion cubic feet (Bcf) of natural gas in storage 0.5 percent lower than last year but 5.1 percent above the five-year average. This is notable because storage started the year below the five-year average. The natural gas rig count closed November at 130 rigs, a 30 percent increase from the previous year.
If you have any questions about the information in this newsletter or would like to talk to someone about your natural gas, please call your sales representative.
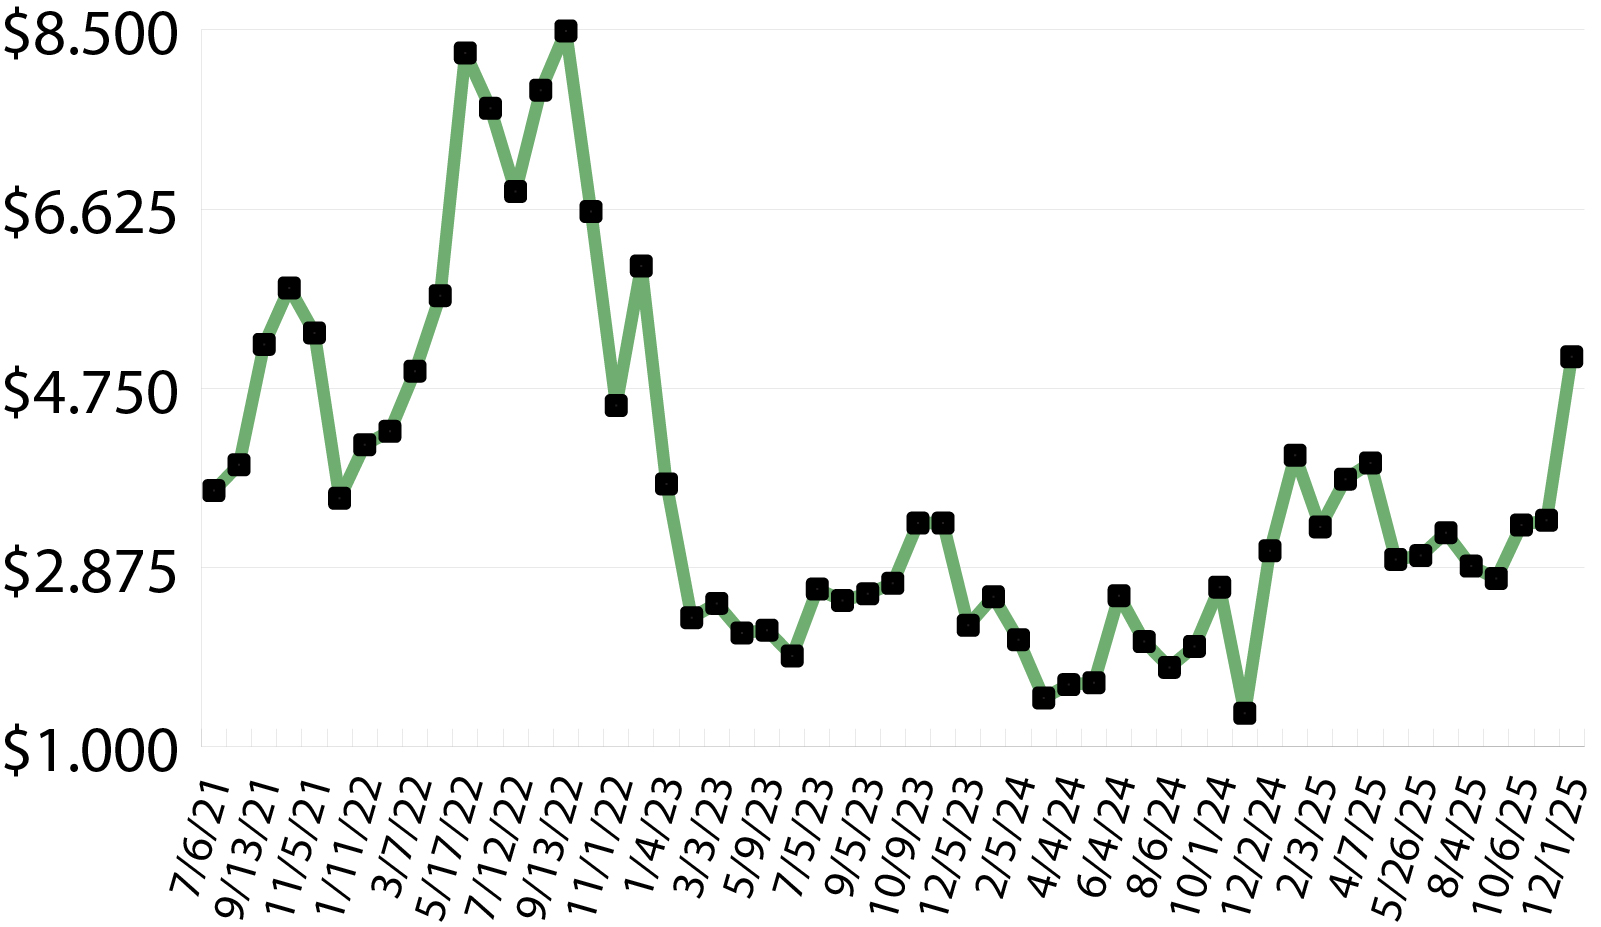
Market Data:
December 10, 2025

December 2025 – Energy News
December 10, 2025
During Thanksgiving week and early December, a powerful winter storm swept across the U.S., dropping up to a foot of snow in some states. In Minneapolis, temperatures plunged 10 degrees below the historical average.
Domestic Demand
Natural gas demand surged in November as winter weather gripped much of the U.S. Overall consumption, including exports, rose 12.7 percent compared to October and 10.7 percent higher than November 2024. Residential and commercial usage nearly doubled during the first 24 days of November compared to early October and climbed 23.6 percent above the same period last year. Industrial consumption also grew, increasing 5.8 percent from October and 1.6 percent last year.
The National Oceanic and Atmospheric Administration (NOAA) has released its long-range forecast for December, January, and February. The forecast predicts below-normal temperatures for the Midwest and the Rocky Mountain region. Extended periods of colder-than-normal temperatures can significantly impact the demand for natural gas.
International Demand
The U.S. strengthened its position as the world’s leading exporter of liquefied natural gas (LNG) in November, setting a record for shipments for the second consecutive month. Colder temperatures abroad and strong output from Cheniere Energy and Venture Global fueled this surge. LNG exports rose from 10.1 million metric tons (mmt) in October to 10.9 mmt in November. Europe received 70 percent of U.S. LNG shipments in November, up from 69 percent in October, highlighting the continent's growing reliance on U.S. LNG.
The European Union (EU) is aiming to eliminate its long-standing dependency on Russian energy by completely phasing out its imports of Russian natural gas by the end of 2027. Meanwhile, Ukraine will begin receiving U.S. LNG through a pipeline across the Balkan Peninsula, with shipments starting from Greece. This agreement aims to help Ukraine meet winter energy needs amid infrastructure damage.
Production & Supply
The U.S. ended November with 3,923 billion cubic feet (Bcf) of natural gas in storage 0.5 percent lower than last year but 5.1 percent above the five-year average. This is notable because storage started the year below the five-year average. The natural gas rig count closed November at 130 rigs, a 30 percent increase from the previous year.
If you have any questions about the information in this newsletter or would like to talk to someone about your natural gas, please call your sales representative.
Market Data:
December 10, 2025
December 10, 2025
December 2025 – Energy News
During Thanksgiving week and early December, a powerful winter storm swept across the U.S., dropping up to a foot of snow in some states. In Minneapolis, temperatures plunged 10 degrees below the historical average.
Domestic Demand
Natural gas demand surged in November as winter weather gripped much of the U.S. Overall consumption, including exports, rose 12.7 percent compared to October and 10.7 percent higher than November 2024. Residential and commercial usage nearly doubled during the first 24 days of November compared to early October and climbed 23.6 percent above the same period last year. Industrial consumption also grew, increasing 5.8 percent from October and 1.6 percent last year.
The National Oceanic and Atmospheric Administration (NOAA) has released its long-range forecast for December, January, and February. The forecast predicts below-normal temperatures for the Midwest and the Rocky Mountain region. Extended periods of colder-than-normal temperatures can significantly impact the demand for natural gas.
International Demand
The U.S. strengthened its position as the world’s leading exporter of liquefied natural gas (LNG) in November, setting a record for shipments for the second consecutive month. Colder temperatures abroad and strong output from Cheniere Energy and Venture Global fueled this surge. LNG exports rose from 10.1 million metric tons (mmt) in October to 10.9 mmt in November. Europe received 70 percent of U.S. LNG shipments in November, up from 69 percent in October, highlighting the continent's growing reliance on U.S. LNG.
The European Union (EU) is aiming to eliminate its long-standing dependency on Russian energy by completely phasing out its imports of Russian natural gas by the end of 2027. Meanwhile, Ukraine will begin receiving U.S. LNG through a pipeline across the Balkan Peninsula, with shipments starting from Greece. This agreement aims to help Ukraine meet winter energy needs amid infrastructure damage.
Production & Supply
The U.S. ended November with 3,923 billion cubic feet (Bcf) of natural gas in storage 0.5 percent lower than last year but 5.1 percent above the five-year average. This is notable because storage started the year below the five-year average. The natural gas rig count closed November at 130 rigs, a 30 percent increase from the previous year.
If you have any questions about the information in this newsletter or would like to talk to someone about your natural gas, please call your sales representative.

December 10, 2025
During Thanksgiving week and early December, a powerful winter storm swept across the U.S., dropping up to a foot of snow in some states. In Minneapolis, temperatures plunged 10 degrees below the historical average.
Domestic Demand
Natural gas demand surged in November as winter weather gripped much of the U.S. Overall consumption, including exports, rose 12.7 percent compared to October and 10.7 percent higher than November 2024. Residential and commercial usage nearly doubled during the first 24 days of November compared to early October and climbed 23.6 percent above the same period last year. Industrial consumption also grew, increasing 5.8 percent from October and 1.6 percent last year.
The National Oceanic and Atmospheric Administration (NOAA) has released its long-range forecast for December, January, and February. The forecast predicts below-normal temperatures for the Midwest and the Rocky Mountain region. Extended periods of colder-than-normal temperatures can significantly impact the demand for natural gas.
International Demand
The U.S. strengthened its position as the world’s leading exporter of liquefied natural gas (LNG) in November, setting a record for shipments for the second consecutive month. Colder temperatures abroad and strong output from Cheniere Energy and Venture Global fueled this surge. LNG exports rose from 10.1 million metric tons (mmt) in October to 10.9 mmt in November. Europe received 70 percent of U.S. LNG shipments in November, up from 69 percent in October, highlighting the continent's growing reliance on U.S. LNG.
The European Union (EU) is aiming to eliminate its long-standing dependency on Russian energy by completely phasing out its imports of Russian natural gas by the end of 2027. Meanwhile, Ukraine will begin receiving U.S. LNG through a pipeline across the Balkan Peninsula, with shipments starting from Greece. This agreement aims to help Ukraine meet winter energy needs amid infrastructure damage.
Production & Supply
The U.S. ended November with 3,923 billion cubic feet (Bcf) of natural gas in storage 0.5 percent lower than last year but 5.1 percent above the five-year average. This is notable because storage started the year below the five-year average. The natural gas rig count closed November at 130 rigs, a 30 percent increase from the previous year.
If you have any questions about the information in this newsletter or would like to talk to someone about your natural gas, please call your sales representative.
December 10, 2025
December 2025 – Energy News
During Thanksgiving week and early December, a powerful winter storm swept across the U.S., dropping up to a foot of snow in some states. In Minneapolis, temperatures plunged 10 degrees below the historical average.
Domestic Demand
Natural gas demand surged in November as winter weather gripped much of the U.S. Overall consumption, including exports, rose 12.7 percent compared to October and 10.7 percent higher than November 2024. Residential and commercial usage nearly doubled during the first 24 days of November compared to early October and climbed 23.6 percent above the same period last year. Industrial consumption also grew, increasing 5.8 percent from October and 1.6 percent last year.
The National Oceanic and Atmospheric Administration (NOAA) has released its long-range forecast for December, January, and February. The forecast predicts below-normal temperatures for the Midwest and the Rocky Mountain region. Extended periods of colder-than-normal temperatures can significantly impact the demand for natural gas.
International Demand
The U.S. strengthened its position as the world’s leading exporter of liquefied natural gas (LNG) in November, setting a record for shipments for the second consecutive month. Colder temperatures abroad and strong output from Cheniere Energy and Venture Global fueled this surge. LNG exports rose from 10.1 million metric tons (mmt) in October to 10.9 mmt in November. Europe received 70 percent of U.S. LNG shipments in November, up from 69 percent in October, highlighting the continent's growing reliance on U.S. LNG.
The European Union (EU) is aiming to eliminate its long-standing dependency on Russian energy by completely phasing out its imports of Russian natural gas by the end of 2027. Meanwhile, Ukraine will begin receiving U.S. LNG through a pipeline across the Balkan Peninsula, with shipments starting from Greece. This agreement aims to help Ukraine meet winter energy needs amid infrastructure damage.
Production & Supply
The U.S. ended November with 3,923 billion cubic feet (Bcf) of natural gas in storage 0.5 percent lower than last year but 5.1 percent above the five-year average. This is notable because storage started the year below the five-year average. The natural gas rig count closed November at 130 rigs, a 30 percent increase from the previous year.
If you have any questions about the information in this newsletter or would like to talk to someone about your natural gas, please call your sales representative.
Make Your Choice Gas Selection in Three Easy Steps
Click here to access our online tool, or call our Choice gas commodity experts at 1 (877) 790-4990.
Step 1: Enter your account number
- Your Black Hills Energy account number is located at the top right-hand corner of your bill.
Step 2: Review price options and make your selection
Step 3: Confirm your selection and enter your control number
- You received a control number in your 2026 Choice Gas selection packet mailed to you from Black Hills Energy. If you cannot locate this, you can retrieve your control number by calling 877-245-3506 or visit choicegas.com
Once enrolled, you will be removed from supplier marketing communications within 24 hours.


Sign Up for Our Energy Newsletters
Sign UpRecent Posts