August 13, 2026
August 2026 – Energy News
Natural gas prices are falling. The EIA's August STEO now projects Henry Hub to average $3.44/MMBtu this year and $3.31/MMBtu in 2027 -- down sharply from last month's forecast of $3.67 and $3.49. Prices are expected to stay below $3.00/MMBtu through October before gradually recovering.
The driver: record domestic production combined with a temporary drop in LNG export demand pushed more gas into storage. Inventories are now on track to hit 3,985 Bcf by end of October -- the highest pre-winter level since 2016 -- giving customers a well-supplied, lower-cost backdrop heading into the heating season.
Domestic Demand
Natural gas remains the top fuel for U.S. power generation, and demand is still growing -- but two developments are reshaping the outlook.
On August 3, the Texas governor paused approval of new data center projects pending a grid review. Texas had been the epicenter of AI-driven electricity demand growth, and the EIA responded by cutting its 2027 Texas load growth forecast from 14% to 6%. Natural gas-fired generation is still rising -- up 2% in 2026 and forecast to grow another 3% in 2027 -- as low gas prices continue to displace coal, which fell 11% in the first half of this year.
The weather outlook is the other key variable heading into winter. NOAA puts the odds of a strong El Nino at 81% by October-December -- a pattern that historically means warmer winters across much of the southern and western U.S. and reduced heating demand.
International Demand
LNG export volumes dipped in July after Freeport LNG -- one of the largest U.S. export terminals -- went down for scheduled maintenance on July 10. The outage removed roughly 2.0 Bcf/d of capacity and will last through late August. Less gas leaving the country has been one of the primary contributors to the storage build this summer.
New capacity is still coming online. Mexico's Energia Costa Azul terminal shipped its first LNG cargo on July 8, opening a Pacific Coast export route for Permian Basin gas and adding 0.4 Bcf/d of capacity. The EIA projects full-year 2026 LNG exports at 17 Bcf/d, rising to 19 Bcf/d in 2027 as additional terminals ramp up.
International demand remains firm. Renewed attacks on tankers in the Strait of Hormuz have kept overseas energy prices elevated, sustaining appetite for U.S. LNG supplies.
Production & Supply
Record U.S. natural gas output is the defining market condition this month. With Freeport maintenance temporarily reducing export demand, that supply has flowed directly into storage -- pushing inventories to 3,117 Bcf as of July 31 (195 Bcf above the five-year average) and on pace for the highest pre-winter level since 2016.
That surplus, combined with the strong El Nino outlook, creates real downside risk for winter prices if heating demand comes in below normal. Hurricane season through September remains the main near-term wildcard for supply.
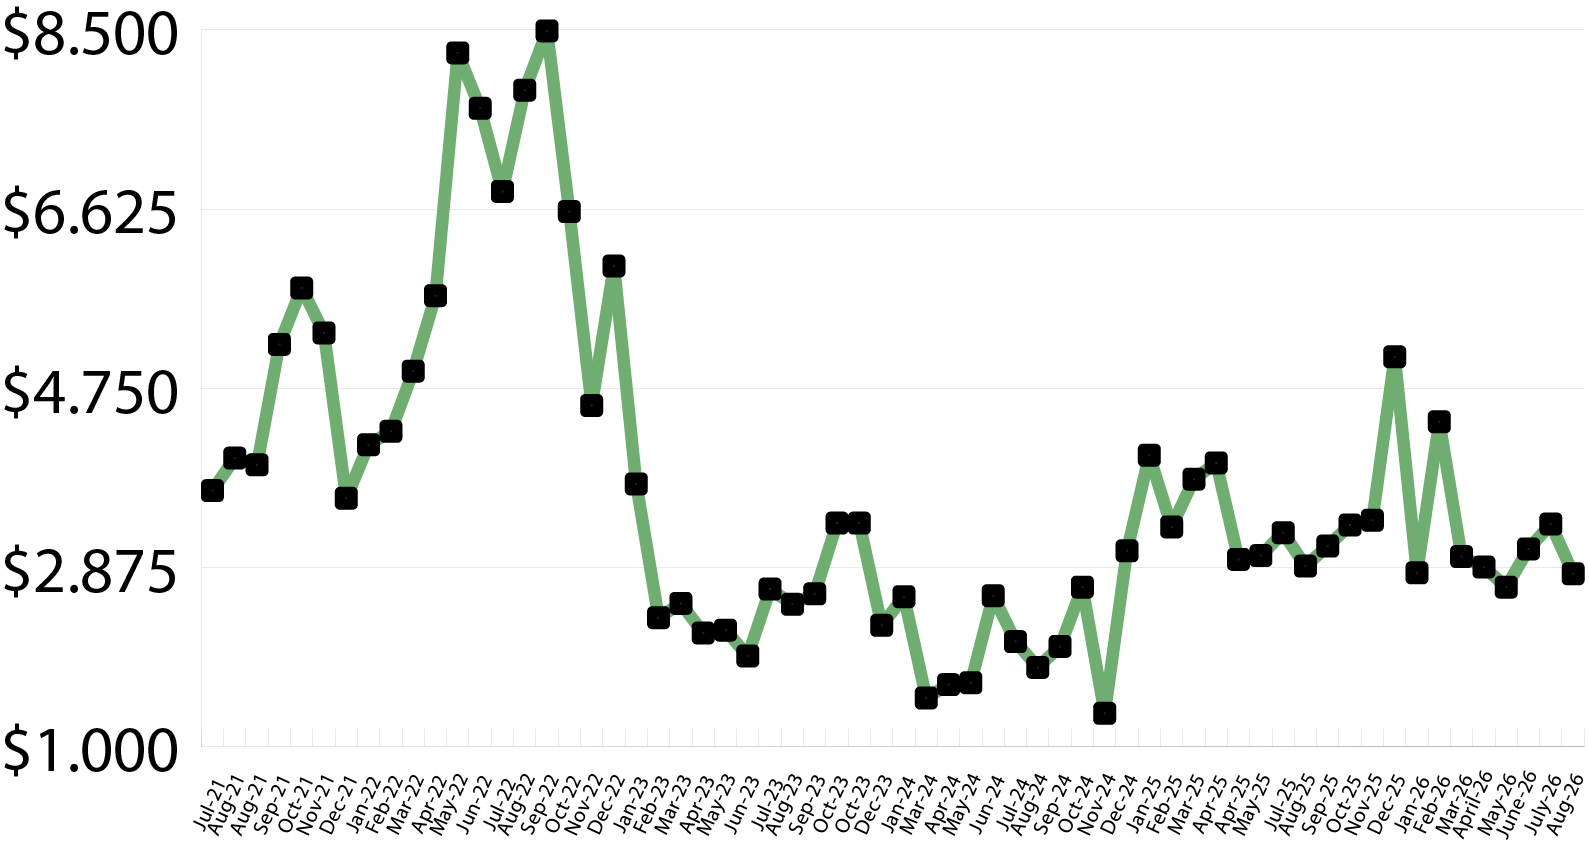
Market Data:
August 13, 2026

August 2026 – Energy News
August 13, 2026
Natural gas prices are falling. The EIA's August STEO now projects Henry Hub to average $3.44/MMBtu this year and $3.31/MMBtu in 2027 -- down sharply from last month's forecast of $3.67 and $3.49. Prices are expected to stay below $3.00/MMBtu through October before gradually recovering.
The driver: record domestic production combined with a temporary drop in LNG export demand pushed more gas into storage. Inventories are now on track to hit 3,985 Bcf by end of October -- the highest pre-winter level since 2016 -- giving customers a well-supplied, lower-cost backdrop heading into the heating season.
Domestic Demand
Natural gas remains the top fuel for U.S. power generation, and demand is still growing -- but two developments are reshaping the outlook.
On August 3, the Texas governor paused approval of new data center projects pending a grid review. Texas had been the epicenter of AI-driven electricity demand growth, and the EIA responded by cutting its 2027 Texas load growth forecast from 14% to 6%. Natural gas-fired generation is still rising -- up 2% in 2026 and forecast to grow another 3% in 2027 -- as low gas prices continue to displace coal, which fell 11% in the first half of this year.
The weather outlook is the other key variable heading into winter. NOAA puts the odds of a strong El Nino at 81% by October-December -- a pattern that historically means warmer winters across much of the southern and western U.S. and reduced heating demand.
International Demand
LNG export volumes dipped in July after Freeport LNG -- one of the largest U.S. export terminals -- went down for scheduled maintenance on July 10. The outage removed roughly 2.0 Bcf/d of capacity and will last through late August. Less gas leaving the country has been one of the primary contributors to the storage build this summer.
New capacity is still coming online. Mexico's Energia Costa Azul terminal shipped its first LNG cargo on July 8, opening a Pacific Coast export route for Permian Basin gas and adding 0.4 Bcf/d of capacity. The EIA projects full-year 2026 LNG exports at 17 Bcf/d, rising to 19 Bcf/d in 2027 as additional terminals ramp up.
International demand remains firm. Renewed attacks on tankers in the Strait of Hormuz have kept overseas energy prices elevated, sustaining appetite for U.S. LNG supplies.
Production & Supply
Record U.S. natural gas output is the defining market condition this month. With Freeport maintenance temporarily reducing export demand, that supply has flowed directly into storage -- pushing inventories to 3,117 Bcf as of July 31 (195 Bcf above the five-year average) and on pace for the highest pre-winter level since 2016.
That surplus, combined with the strong El Nino outlook, creates real downside risk for winter prices if heating demand comes in below normal. Hurricane season through September remains the main near-term wildcard for supply.
Market Data:
August 13, 2026
August 13, 2026
August 2026 – Energy News
Natural gas prices are falling. The EIA's August STEO now projects Henry Hub to average $3.44/MMBtu this year and $3.31/MMBtu in 2027 -- down sharply from last month's forecast of $3.67 and $3.49. Prices are expected to stay below $3.00/MMBtu through October before gradually recovering.
The driver: record domestic production combined with a temporary drop in LNG export demand pushed more gas into storage. Inventories are now on track to hit 3,985 Bcf by end of October -- the highest pre-winter level since 2016 -- giving customers a well-supplied, lower-cost backdrop heading into the heating season.
Domestic Demand
Natural gas remains the top fuel for U.S. power generation, and demand is still growing -- but two developments are reshaping the outlook.
On August 3, the Texas governor paused approval of new data center projects pending a grid review. Texas had been the epicenter of AI-driven electricity demand growth, and the EIA responded by cutting its 2027 Texas load growth forecast from 14% to 6%. Natural gas-fired generation is still rising -- up 2% in 2026 and forecast to grow another 3% in 2027 -- as low gas prices continue to displace coal, which fell 11% in the first half of this year.
The weather outlook is the other key variable heading into winter. NOAA puts the odds of a strong El Nino at 81% by October-December -- a pattern that historically means warmer winters across much of the southern and western U.S. and reduced heating demand.
International Demand
LNG export volumes dipped in July after Freeport LNG -- one of the largest U.S. export terminals -- went down for scheduled maintenance on July 10. The outage removed roughly 2.0 Bcf/d of capacity and will last through late August. Less gas leaving the country has been one of the primary contributors to the storage build this summer.
New capacity is still coming online. Mexico's Energia Costa Azul terminal shipped its first LNG cargo on July 8, opening a Pacific Coast export route for Permian Basin gas and adding 0.4 Bcf/d of capacity. The EIA projects full-year 2026 LNG exports at 17 Bcf/d, rising to 19 Bcf/d in 2027 as additional terminals ramp up.
International demand remains firm. Renewed attacks on tankers in the Strait of Hormuz have kept overseas energy prices elevated, sustaining appetite for U.S. LNG supplies.
Production & Supply
Record U.S. natural gas output is the defining market condition this month. With Freeport maintenance temporarily reducing export demand, that supply has flowed directly into storage -- pushing inventories to 3,117 Bcf as of July 31 (195 Bcf above the five-year average) and on pace for the highest pre-winter level since 2016.
That surplus, combined with the strong El Nino outlook, creates real downside risk for winter prices if heating demand comes in below normal. Hurricane season through September remains the main near-term wildcard for supply.
August 13, 2026
August 2026 – Energy News
Natural gas prices are falling. The EIA's August STEO now projects Henry Hub to average $3.44/MMBtu this year and $3.31/MMBtu in 2027 -- down sharply from last month's forecast of $3.67 and $3.49. Prices are expected to stay below $3.00/MMBtu through October before gradually recovering.
The driver: record domestic production combined with a temporary drop in LNG export demand pushed more gas into storage. Inventories are now on track to hit 3,985 Bcf by end of October -- the highest pre-winter level since 2016 -- giving customers a well-supplied, lower-cost backdrop heading into the heating season.
Domestic Demand
Natural gas remains the top fuel for U.S. power generation, and demand is still growing -- but two developments are reshaping the outlook.
On August 3, the Texas governor paused approval of new data center projects pending a grid review. Texas had been the epicenter of AI-driven electricity demand growth, and the EIA responded by cutting its 2027 Texas load growth forecast from 14% to 6%. Natural gas-fired generation is still rising -- up 2% in 2026 and forecast to grow another 3% in 2027 -- as low gas prices continue to displace coal, which fell 11% in the first half of this year.
The weather outlook is the other key variable heading into winter. NOAA puts the odds of a strong El Nino at 81% by October-December -- a pattern that historically means warmer winters across much of the southern and western U.S. and reduced heating demand.
International Demand
LNG export volumes dipped in July after Freeport LNG -- one of the largest U.S. export terminals -- went down for scheduled maintenance on July 10. The outage removed roughly 2.0 Bcf/d of capacity and will last through late August. Less gas leaving the country has been one of the primary contributors to the storage build this summer.
New capacity is still coming online. Mexico's Energia Costa Azul terminal shipped its first LNG cargo on July 8, opening a Pacific Coast export route for Permian Basin gas and adding 0.4 Bcf/d of capacity. The EIA projects full-year 2026 LNG exports at 17 Bcf/d, rising to 19 Bcf/d in 2027 as additional terminals ramp up.
International demand remains firm. Renewed attacks on tankers in the Strait of Hormuz have kept overseas energy prices elevated, sustaining appetite for U.S. LNG supplies.
Production & Supply
Record U.S. natural gas output is the defining market condition this month. With Freeport maintenance temporarily reducing export demand, that supply has flowed directly into storage -- pushing inventories to 3,117 Bcf as of July 31 (195 Bcf above the five-year average) and on pace for the highest pre-winter level since 2016.
That surplus, combined with the strong El Nino outlook, creates real downside risk for winter prices if heating demand comes in below normal. Hurricane season through September remains the main near-term wildcard for supply.
August 13, 2026
August 2026 – Energy News
Natural gas prices are falling. The EIA's August STEO now projects Henry Hub to average $3.44/MMBtu this year and $3.31/MMBtu in 2027 -- down sharply from last month's forecast of $3.67 and $3.49. Prices are expected to stay below $3.00/MMBtu through October before gradually recovering.
The driver: record domestic production combined with a temporary drop in LNG export demand pushed more gas into storage. Inventories are now on track to hit 3,985 Bcf by end of October -- the highest pre-winter level since 2016 -- giving customers a well-supplied, lower-cost backdrop heading into the heating season.
Domestic Demand
Natural gas remains the top fuel for U.S. power generation, and demand is still growing -- but two developments are reshaping the outlook.
On August 3, the Texas governor paused approval of new data center projects pending a grid review. Texas had been the epicenter of AI-driven electricity demand growth, and the EIA responded by cutting its 2027 Texas load growth forecast from 14% to 6%. Natural gas-fired generation is still rising -- up 2% in 2026 and forecast to grow another 3% in 2027 -- as low gas prices continue to displace coal, which fell 11% in the first half of this year.
The weather outlook is the other key variable heading into winter. NOAA puts the odds of a strong El Nino at 81% by October-December -- a pattern that historically means warmer winters across much of the southern and western U.S. and reduced heating demand.
International Demand
LNG export volumes dipped in July after Freeport LNG -- one of the largest U.S. export terminals -- went down for scheduled maintenance on July 10. The outage removed roughly 2.0 Bcf/d of capacity and will last through late August. Less gas leaving the country has been one of the primary contributors to the storage build this summer.
New capacity is still coming online. Mexico's Energia Costa Azul terminal shipped its first LNG cargo on July 8, opening a Pacific Coast export route for Permian Basin gas and adding 0.4 Bcf/d of capacity. The EIA projects full-year 2026 LNG exports at 17 Bcf/d, rising to 19 Bcf/d in 2027 as additional terminals ramp up.
International demand remains firm. Renewed attacks on tankers in the Strait of Hormuz have kept overseas energy prices elevated, sustaining appetite for U.S. LNG supplies.
Production & Supply
Record U.S. natural gas output is the defining market condition this month. With Freeport maintenance temporarily reducing export demand, that supply has flowed directly into storage -- pushing inventories to 3,117 Bcf as of July 31 (195 Bcf above the five-year average) and on pace for the highest pre-winter level since 2016.
That surplus, combined with the strong El Nino outlook, creates real downside risk for winter prices if heating demand comes in below normal. Hurricane season through September remains the main near-term wildcard for supply.

August 13, 2026
Natural gas prices are falling. The EIA's August STEO now projects Henry Hub to average $3.44/MMBtu this year and $3.31/MMBtu in 2027 -- down sharply from last month's forecast of $3.67 and $3.49. Prices are expected to stay below $3.00/MMBtu through October before gradually recovering.
The driver: record domestic production combined with a temporary drop in LNG export demand pushed more gas into storage. Inventories are now on track to hit 3,985 Bcf by end of October -- the highest pre-winter level since 2016 -- giving customers a well-supplied, lower-cost backdrop heading into the heating season.
Domestic Demand
Natural gas remains the top fuel for U.S. power generation, and demand is still growing -- but two developments are reshaping the outlook.
On August 3, the Texas governor paused approval of new data center projects pending a grid review. Texas had been the epicenter of AI-driven electricity demand growth, and the EIA responded by cutting its 2027 Texas load growth forecast from 14% to 6%. Natural gas-fired generation is still rising -- up 2% in 2026 and forecast to grow another 3% in 2027 -- as low gas prices continue to displace coal, which fell 11% in the first half of this year.
The weather outlook is the other key variable heading into winter. NOAA puts the odds of a strong El Nino at 81% by October-December -- a pattern that historically means warmer winters across much of the southern and western U.S. and reduced heating demand.
International Demand
LNG export volumes dipped in July after Freeport LNG -- one of the largest U.S. export terminals -- went down for scheduled maintenance on July 10. The outage removed roughly 2.0 Bcf/d of capacity and will last through late August. Less gas leaving the country has been one of the primary contributors to the storage build this summer.
New capacity is still coming online. Mexico's Energia Costa Azul terminal shipped its first LNG cargo on July 8, opening a Pacific Coast export route for Permian Basin gas and adding 0.4 Bcf/d of capacity. The EIA projects full-year 2026 LNG exports at 17 Bcf/d, rising to 19 Bcf/d in 2027 as additional terminals ramp up.
International demand remains firm. Renewed attacks on tankers in the Strait of Hormuz have kept overseas energy prices elevated, sustaining appetite for U.S. LNG supplies.
Production & Supply
Record U.S. natural gas output is the defining market condition this month. With Freeport maintenance temporarily reducing export demand, that supply has flowed directly into storage -- pushing inventories to 3,117 Bcf as of July 31 (195 Bcf above the five-year average) and on pace for the highest pre-winter level since 2016.
That surplus, combined with the strong El Nino outlook, creates real downside risk for winter prices if heating demand comes in below normal. Hurricane season through September remains the main near-term wildcard for supply.
August 13, 2026
August 2026 – Energy News
Natural gas prices are falling. The EIA's August STEO now projects Henry Hub to average $3.44/MMBtu this year and $3.31/MMBtu in 2027 -- down sharply from last month's forecast of $3.67 and $3.49. Prices are expected to stay below $3.00/MMBtu through October before gradually recovering.
The driver: record domestic production combined with a temporary drop in LNG export demand pushed more gas into storage. Inventories are now on track to hit 3,985 Bcf by end of October -- the highest pre-winter level since 2016 -- giving customers a well-supplied, lower-cost backdrop heading into the heating season.
Domestic Demand
Natural gas remains the top fuel for U.S. power generation, and demand is still growing -- but two developments are reshaping the outlook.
On August 3, the Texas governor paused approval of new data center projects pending a grid review. Texas had been the epicenter of AI-driven electricity demand growth, and the EIA responded by cutting its 2027 Texas load growth forecast from 14% to 6%. Natural gas-fired generation is still rising -- up 2% in 2026 and forecast to grow another 3% in 2027 -- as low gas prices continue to displace coal, which fell 11% in the first half of this year.
The weather outlook is the other key variable heading into winter. NOAA puts the odds of a strong El Nino at 81% by October-December -- a pattern that historically means warmer winters across much of the southern and western U.S. and reduced heating demand.
International Demand
LNG export volumes dipped in July after Freeport LNG -- one of the largest U.S. export terminals -- went down for scheduled maintenance on July 10. The outage removed roughly 2.0 Bcf/d of capacity and will last through late August. Less gas leaving the country has been one of the primary contributors to the storage build this summer.
New capacity is still coming online. Mexico's Energia Costa Azul terminal shipped its first LNG cargo on July 8, opening a Pacific Coast export route for Permian Basin gas and adding 0.4 Bcf/d of capacity. The EIA projects full-year 2026 LNG exports at 17 Bcf/d, rising to 19 Bcf/d in 2027 as additional terminals ramp up.
International demand remains firm. Renewed attacks on tankers in the Strait of Hormuz have kept overseas energy prices elevated, sustaining appetite for U.S. LNG supplies.
Production & Supply
Record U.S. natural gas output is the defining market condition this month. With Freeport maintenance temporarily reducing export demand, that supply has flowed directly into storage -- pushing inventories to 3,117 Bcf as of July 31 (195 Bcf above the five-year average) and on pace for the highest pre-winter level since 2016.
That surplus, combined with the strong El Nino outlook, creates real downside risk for winter prices if heating demand comes in below normal. Hurricane season through September remains the main near-term wildcard for supply.
August 13, 2026
August 2026 – Energy News
Natural gas prices are falling. The EIA's August STEO now projects Henry Hub to average $3.44/MMBtu this year and $3.31/MMBtu in 2027 -- down sharply from last month's forecast of $3.67 and $3.49. Prices are expected to stay below $3.00/MMBtu through October before gradually recovering.
The driver: record domestic production combined with a temporary drop in LNG export demand pushed more gas into storage. Inventories are now on track to hit 3,985 Bcf by end of October -- the highest pre-winter level since 2016 -- giving customers a well-supplied, lower-cost backdrop heading into the heating season.
Domestic Demand
Natural gas remains the top fuel for U.S. power generation, and demand is still growing -- but two developments are reshaping the outlook.
On August 3, the Texas governor paused approval of new data center projects pending a grid review. Texas had been the epicenter of AI-driven electricity demand growth, and the EIA responded by cutting its 2027 Texas load growth forecast from 14% to 6%. Natural gas-fired generation is still rising -- up 2% in 2026 and forecast to grow another 3% in 2027 -- as low gas prices continue to displace coal, which fell 11% in the first half of this year.
The weather outlook is the other key variable heading into winter. NOAA puts the odds of a strong El Nino at 81% by October-December -- a pattern that historically means warmer winters across much of the southern and western U.S. and reduced heating demand.
International Demand
LNG export volumes dipped in July after Freeport LNG -- one of the largest U.S. export terminals -- went down for scheduled maintenance on July 10. The outage removed roughly 2.0 Bcf/d of capacity and will last through late August. Less gas leaving the country has been one of the primary contributors to the storage build this summer.
New capacity is still coming online. Mexico's Energia Costa Azul terminal shipped its first LNG cargo on July 8, opening a Pacific Coast export route for Permian Basin gas and adding 0.4 Bcf/d of capacity. The EIA projects full-year 2026 LNG exports at 17 Bcf/d, rising to 19 Bcf/d in 2027 as additional terminals ramp up.
International demand remains firm. Renewed attacks on tankers in the Strait of Hormuz have kept overseas energy prices elevated, sustaining appetite for U.S. LNG supplies.
Production & Supply
Record U.S. natural gas output is the defining market condition this month. With Freeport maintenance temporarily reducing export demand, that supply has flowed directly into storage -- pushing inventories to 3,117 Bcf as of July 31 (195 Bcf above the five-year average) and on pace for the highest pre-winter level since 2016.
That surplus, combined with the strong El Nino outlook, creates real downside risk for winter prices if heating demand comes in below normal. Hurricane season through September remains the main near-term wildcard for supply.
Make Your Choice Gas Selection in Three Easy Steps
Click here to access our online tool, or call our Choice gas commodity experts at 1 (877) 790-4990.
Step 1: Enter your account number
- Your Black Hills Energy account number is located at the top right-hand corner of your bill.
Step 2: Review price options and make your selection
Step 3: Confirm your selection and enter your control number
- You received a control number in your 2026 Choice Gas selection packet mailed to you from Black Hills Energy. If you cannot locate this, you can retrieve your control number by calling 877-245-3506 or visit choicegas.com
Once enrolled, you will be removed from supplier marketing communications within 24 hours.


Sign Up for Our Energy Newsletters
Sign UpRecent Posts