March 20, 2026
Weekly Energy News
Market Commentary: The U.S. natural gas market recorded an unusual late-winter storage build of 35 Bcf for the week ending March 13, effectively erasing the deficit relative to the five-year average, according to the Energy Information Administration.
The reported injection aligned with consensus expectations from the weekly storage survey by Platts, part of S&P Global Energy, as unseasonably warm temperatures reduced heating demand during the period.
Following the report, NYMEX prompt-month Henry Hub futures showed minimal movement, hovering near $3.20 per MMBtu, based on data from CME Group.
April 2026 NYMEX closed Thursday at $3.168
· High for the day $3.270
· Low for the day $3.103
Early trading for the prompt month is trading at $3.074
· https://www.cmegroup.com/markets/energy/natural-gas/natural-gas.html
· https://www.fxempire.com/commodities/natural-gas
U.S. natural gas fundamentals loosened significantly during the week ending March 13, though analysts expect the market to shift back to withdrawals in the current week as colder weather returns.
Total demand fell by nearly 11 Bcf/d to around 108 Bcf/d, driven by weaker heating and power generation needs, according to S&P Global Energy CERA data. Residential and commercial demand dropped 27% week over week to 22 Bcf/d, while power sector demand declined 7% to roughly 29 Bcf/d.
On the supply side, total volumes decreased by more than 1 Bcf/d, largely due to lower imports from Canada, while U.S. dry gas production remained relatively steady.
More recently, demand has rebounded. In the six days through March 19, residential and commercial consumption jumped over 60% to nearly 33 Bcf/d compared to the same period the prior week, while power demand increased about 5% to approximately 31 Bcf/d. Supply has edged up 1%, primarily supported by stronger Canadian imports, with U.S. production still holding flat.
International: QatarEnergy reported significant damage to its LNG facilities at Ras Laffan Industrial City following recent Iranian missile strikes, with repairs expected to take 3–5 years. The disruption has taken roughly 17% of export capacity offline, including two liquefaction trains (4 and 6), totaling 12.8 mtpa. As a result, the company may declare force majeure on some long-term contracts, with supply impacts expected across Europe and Asia and an estimated $20 billion in annual revenue losses.
In response, U.S. LNG prices have surged to a three-year high. Strong global demand has pushed U.S. liquefaction utilization above typical levels, with plants operating well above capacity in recent months. March utilization is projected at 11.29 million mt—up 10% month over month and 20% year over year—though sustained operations 10–15% above capacity may be difficult to maintain.
EIA Storage: Working gas in storage totaled 1,883 Bcf as of Friday, March 13, 2026, according to EIA estimates, reflecting a 35 Bcf increase week over week. Inventories were 177 Bcf above year-ago levels and 47 Bcf higher than the five-year average of 1,836 Bcf. Overall, storage levels remain within the historical five-year range.
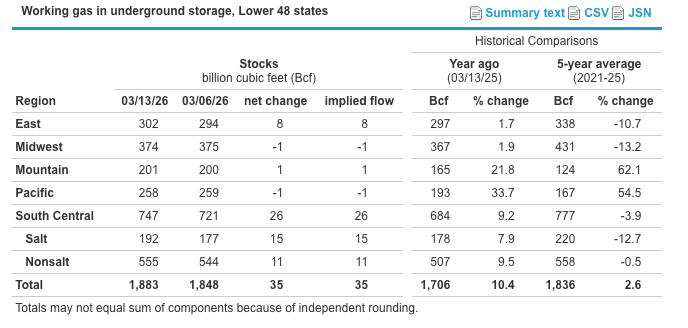
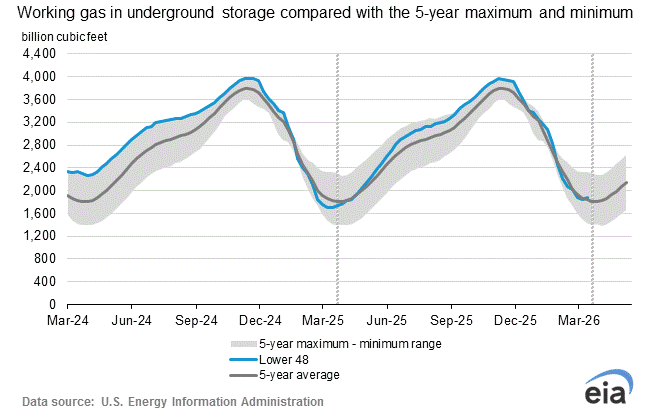
Note: The shaded area indicates the range between the historical minimum and maximum values for the weekly series from 2021 through 2025. The dashed vertical lines indicate current and year-ago weekly periods.
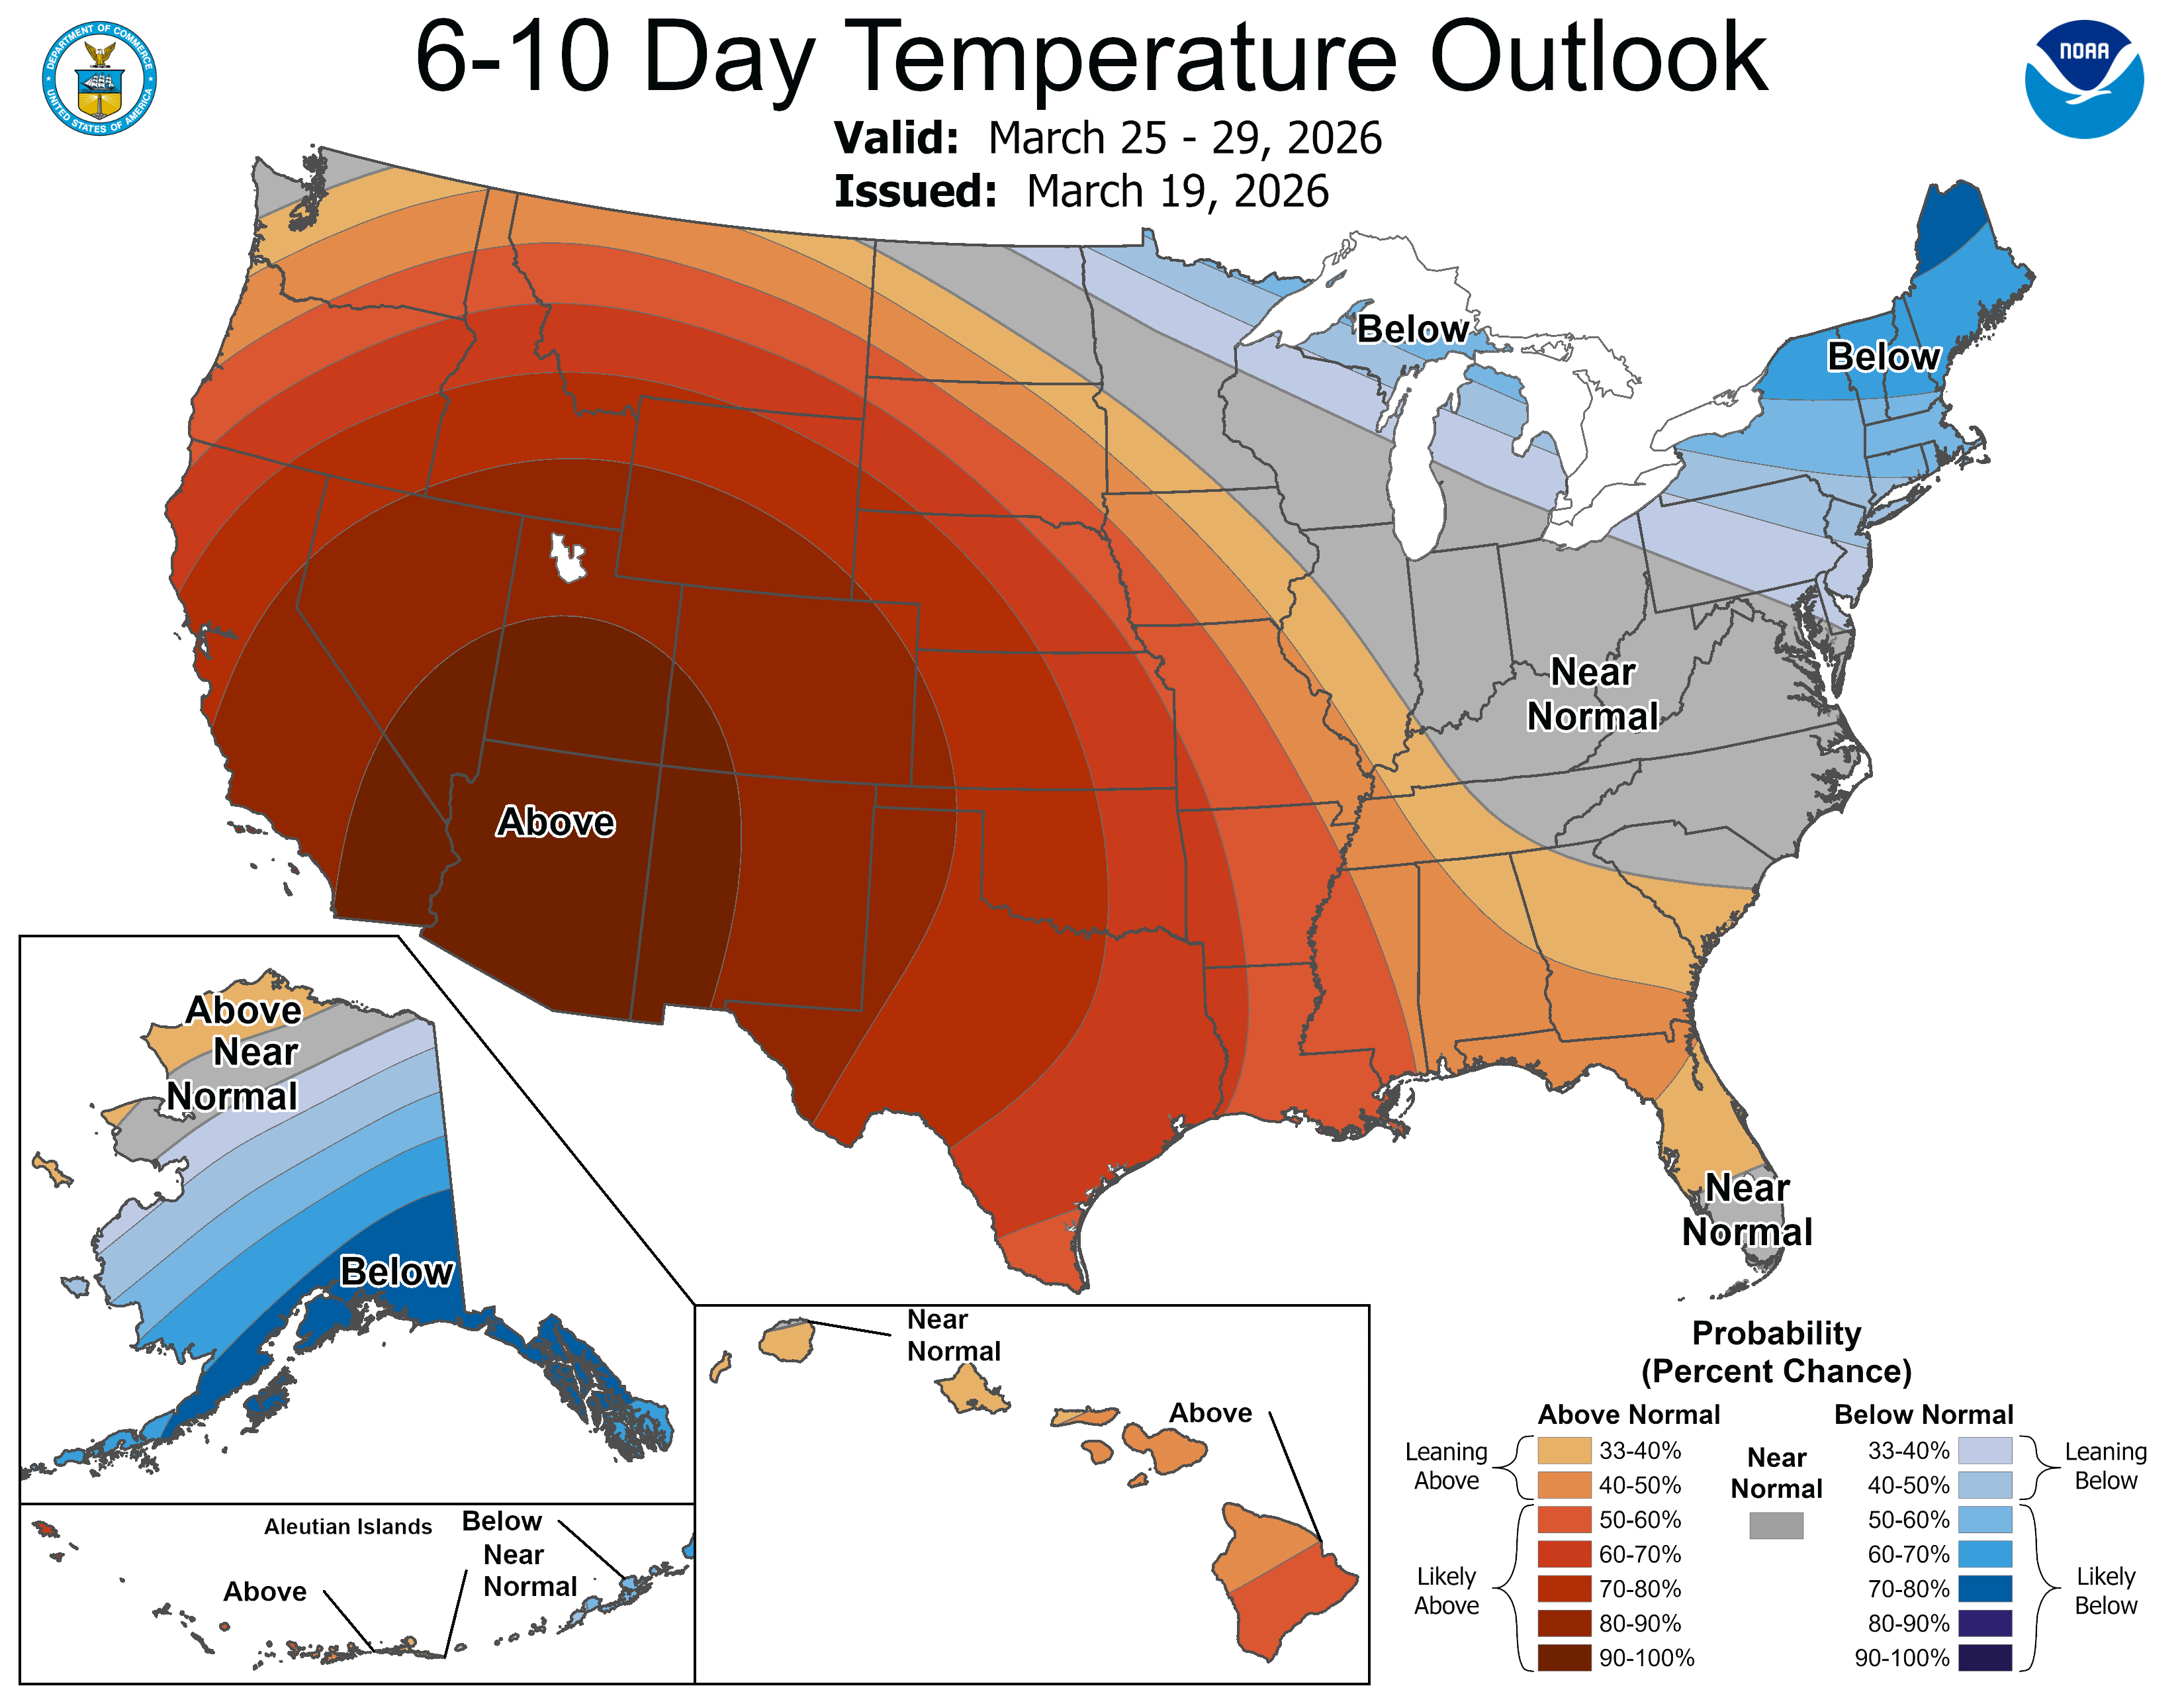
Weather: The April 2026 temperature outlook indicates that much of the U.S. is likely to experience warmer-than-normal conditions, with the strongest warmth expected across the South, Central states, and interior Northwest. This pattern is supported by current drought conditions, below-normal soil moisture, and below-average snowpack across much of the West, which will allow the land to heat up more quickly as spring progresses. Florida and Utah are particularly likely to see above-average temperatures, while northwestern Alaska may also experience warmer conditions. In contrast, parts of the Great Lakes, Northeast, Mid-Atlantic, and Pacific Northwest have roughly equal chances of being above, near, or below normal, reflecting greater uncertainty in those regions. Overall, most of the U.S. can expect an early, warmer start to spring, though cooler stretches may still occur in the northern and northeastern states. This forecast is based on the official 30‑day outlook discussion for April 2026 from the Climate Prediction Center of the National Oceanic and Atmospheric Administration.
Market Data:
March 20, 2026

Weekly Energy News
March 20, 2026
Market Commentary: The U.S. natural gas market recorded an unusual late-winter storage build of 35 Bcf for the week ending March 13, effectively erasing the deficit relative to the five-year average, according to the Energy Information Administration.
The reported injection aligned with consensus expectations from the weekly storage survey by Platts, part of S&P Global Energy, as unseasonably warm temperatures reduced heating demand during the period.
Following the report, NYMEX prompt-month Henry Hub futures showed minimal movement, hovering near $3.20 per MMBtu, based on data from CME Group.
April 2026 NYMEX closed Thursday at $3.168
· High for the day $3.270
· Low for the day $3.103
Early trading for the prompt month is trading at $3.074
· https://www.cmegroup.com/markets/energy/natural-gas/natural-gas.html
· https://www.fxempire.com/commodities/natural-gas
U.S. natural gas fundamentals loosened significantly during the week ending March 13, though analysts expect the market to shift back to withdrawals in the current week as colder weather returns.
Total demand fell by nearly 11 Bcf/d to around 108 Bcf/d, driven by weaker heating and power generation needs, according to S&P Global Energy CERA data. Residential and commercial demand dropped 27% week over week to 22 Bcf/d, while power sector demand declined 7% to roughly 29 Bcf/d.
On the supply side, total volumes decreased by more than 1 Bcf/d, largely due to lower imports from Canada, while U.S. dry gas production remained relatively steady.
More recently, demand has rebounded. In the six days through March 19, residential and commercial consumption jumped over 60% to nearly 33 Bcf/d compared to the same period the prior week, while power demand increased about 5% to approximately 31 Bcf/d. Supply has edged up 1%, primarily supported by stronger Canadian imports, with U.S. production still holding flat.
International: QatarEnergy reported significant damage to its LNG facilities at Ras Laffan Industrial City following recent Iranian missile strikes, with repairs expected to take 3–5 years. The disruption has taken roughly 17% of export capacity offline, including two liquefaction trains (4 and 6), totaling 12.8 mtpa. As a result, the company may declare force majeure on some long-term contracts, with supply impacts expected across Europe and Asia and an estimated $20 billion in annual revenue losses.
In response, U.S. LNG prices have surged to a three-year high. Strong global demand has pushed U.S. liquefaction utilization above typical levels, with plants operating well above capacity in recent months. March utilization is projected at 11.29 million mt—up 10% month over month and 20% year over year—though sustained operations 10–15% above capacity may be difficult to maintain.
EIA Storage: Working gas in storage totaled 1,883 Bcf as of Friday, March 13, 2026, according to EIA estimates, reflecting a 35 Bcf increase week over week. Inventories were 177 Bcf above year-ago levels and 47 Bcf higher than the five-year average of 1,836 Bcf. Overall, storage levels remain within the historical five-year range.
Note: The shaded area indicates the range between the historical minimum and maximum values for the weekly series from 2021 through 2025. The dashed vertical lines indicate current and year-ago weekly periods.
Weather: The April 2026 temperature outlook indicates that much of the U.S. is likely to experience warmer-than-normal conditions, with the strongest warmth expected across the South, Central states, and interior Northwest. This pattern is supported by current drought conditions, below-normal soil moisture, and below-average snowpack across much of the West, which will allow the land to heat up more quickly as spring progresses. Florida and Utah are particularly likely to see above-average temperatures, while northwestern Alaska may also experience warmer conditions. In contrast, parts of the Great Lakes, Northeast, Mid-Atlantic, and Pacific Northwest have roughly equal chances of being above, near, or below normal, reflecting greater uncertainty in those regions. Overall, most of the U.S. can expect an early, warmer start to spring, though cooler stretches may still occur in the northern and northeastern states. This forecast is based on the official 30‑day outlook discussion for April 2026 from the Climate Prediction Center of the National Oceanic and Atmospheric Administration.
Market Data:
March 20, 2026
March 20, 2026
Weekly Energy News
Market Commentary: The U.S. natural gas market recorded an unusual late-winter storage build of 35 Bcf for the week ending March 13, effectively erasing the deficit relative to the five-year average, according to the Energy Information Administration.
The reported injection aligned with consensus expectations from the weekly storage survey by Platts, part of S&P Global Energy, as unseasonably warm temperatures reduced heating demand during the period.
Following the report, NYMEX prompt-month Henry Hub futures showed minimal movement, hovering near $3.20 per MMBtu, based on data from CME Group.
April 2026 NYMEX closed Thursday at $3.168
· High for the day $3.270
· Low for the day $3.103
Early trading for the prompt month is trading at $3.074
· https://www.cmegroup.com/markets/energy/natural-gas/natural-gas.html
· https://www.fxempire.com/commodities/natural-gas
U.S. natural gas fundamentals loosened significantly during the week ending March 13, though analysts expect the market to shift back to withdrawals in the current week as colder weather returns.
Total demand fell by nearly 11 Bcf/d to around 108 Bcf/d, driven by weaker heating and power generation needs, according to S&P Global Energy CERA data. Residential and commercial demand dropped 27% week over week to 22 Bcf/d, while power sector demand declined 7% to roughly 29 Bcf/d.
On the supply side, total volumes decreased by more than 1 Bcf/d, largely due to lower imports from Canada, while U.S. dry gas production remained relatively steady.
More recently, demand has rebounded. In the six days through March 19, residential and commercial consumption jumped over 60% to nearly 33 Bcf/d compared to the same period the prior week, while power demand increased about 5% to approximately 31 Bcf/d. Supply has edged up 1%, primarily supported by stronger Canadian imports, with U.S. production still holding flat.
International: QatarEnergy reported significant damage to its LNG facilities at Ras Laffan Industrial City following recent Iranian missile strikes, with repairs expected to take 3–5 years. The disruption has taken roughly 17% of export capacity offline, including two liquefaction trains (4 and 6), totaling 12.8 mtpa. As a result, the company may declare force majeure on some long-term contracts, with supply impacts expected across Europe and Asia and an estimated $20 billion in annual revenue losses.
In response, U.S. LNG prices have surged to a three-year high. Strong global demand has pushed U.S. liquefaction utilization above typical levels, with plants operating well above capacity in recent months. March utilization is projected at 11.29 million mt—up 10% month over month and 20% year over year—though sustained operations 10–15% above capacity may be difficult to maintain.
EIA Storage: Working gas in storage totaled 1,883 Bcf as of Friday, March 13, 2026, according to EIA estimates, reflecting a 35 Bcf increase week over week. Inventories were 177 Bcf above year-ago levels and 47 Bcf higher than the five-year average of 1,836 Bcf. Overall, storage levels remain within the historical five-year range.
Note: The shaded area indicates the range between the historical minimum and maximum values for the weekly series from 2021 through 2025. The dashed vertical lines indicate current and year-ago weekly periods.
Weather: The April 2026 temperature outlook indicates that much of the U.S. is likely to experience warmer-than-normal conditions, with the strongest warmth expected across the South, Central states, and interior Northwest. This pattern is supported by current drought conditions, below-normal soil moisture, and below-average snowpack across much of the West, which will allow the land to heat up more quickly as spring progresses. Florida and Utah are particularly likely to see above-average temperatures, while northwestern Alaska may also experience warmer conditions. In contrast, parts of the Great Lakes, Northeast, Mid-Atlantic, and Pacific Northwest have roughly equal chances of being above, near, or below normal, reflecting greater uncertainty in those regions. Overall, most of the U.S. can expect an early, warmer start to spring, though cooler stretches may still occur in the northern and northeastern states. This forecast is based on the official 30‑day outlook discussion for April 2026 from the Climate Prediction Center of the National Oceanic and Atmospheric Administration.

March 20, 2026
Market Commentary: The U.S. natural gas market recorded an unusual late-winter storage build of 35 Bcf for the week ending March 13, effectively erasing the deficit relative to the five-year average, according to the Energy Information Administration.
The reported injection aligned with consensus expectations from the weekly storage survey by Platts, part of S&P Global Energy, as unseasonably warm temperatures reduced heating demand during the period.
Following the report, NYMEX prompt-month Henry Hub futures showed minimal movement, hovering near $3.20 per MMBtu, based on data from CME Group.
April 2026 NYMEX closed Thursday at $3.168
· High for the day $3.270
· Low for the day $3.103
Early trading for the prompt month is trading at $3.074
· https://www.cmegroup.com/markets/energy/natural-gas/natural-gas.html
· https://www.fxempire.com/commodities/natural-gas
U.S. natural gas fundamentals loosened significantly during the week ending March 13, though analysts expect the market to shift back to withdrawals in the current week as colder weather returns.
Total demand fell by nearly 11 Bcf/d to around 108 Bcf/d, driven by weaker heating and power generation needs, according to S&P Global Energy CERA data. Residential and commercial demand dropped 27% week over week to 22 Bcf/d, while power sector demand declined 7% to roughly 29 Bcf/d.
On the supply side, total volumes decreased by more than 1 Bcf/d, largely due to lower imports from Canada, while U.S. dry gas production remained relatively steady.
More recently, demand has rebounded. In the six days through March 19, residential and commercial consumption jumped over 60% to nearly 33 Bcf/d compared to the same period the prior week, while power demand increased about 5% to approximately 31 Bcf/d. Supply has edged up 1%, primarily supported by stronger Canadian imports, with U.S. production still holding flat.
International: QatarEnergy reported significant damage to its LNG facilities at Ras Laffan Industrial City following recent Iranian missile strikes, with repairs expected to take 3–5 years. The disruption has taken roughly 17% of export capacity offline, including two liquefaction trains (4 and 6), totaling 12.8 mtpa. As a result, the company may declare force majeure on some long-term contracts, with supply impacts expected across Europe and Asia and an estimated $20 billion in annual revenue losses.
In response, U.S. LNG prices have surged to a three-year high. Strong global demand has pushed U.S. liquefaction utilization above typical levels, with plants operating well above capacity in recent months. March utilization is projected at 11.29 million mt—up 10% month over month and 20% year over year—though sustained operations 10–15% above capacity may be difficult to maintain.
EIA Storage: Working gas in storage totaled 1,883 Bcf as of Friday, March 13, 2026, according to EIA estimates, reflecting a 35 Bcf increase week over week. Inventories were 177 Bcf above year-ago levels and 47 Bcf higher than the five-year average of 1,836 Bcf. Overall, storage levels remain within the historical five-year range.
Note: The shaded area indicates the range between the historical minimum and maximum values for the weekly series from 2021 through 2025. The dashed vertical lines indicate current and year-ago weekly periods.
Weather: The April 2026 temperature outlook indicates that much of the U.S. is likely to experience warmer-than-normal conditions, with the strongest warmth expected across the South, Central states, and interior Northwest. This pattern is supported by current drought conditions, below-normal soil moisture, and below-average snowpack across much of the West, which will allow the land to heat up more quickly as spring progresses. Florida and Utah are particularly likely to see above-average temperatures, while northwestern Alaska may also experience warmer conditions. In contrast, parts of the Great Lakes, Northeast, Mid-Atlantic, and Pacific Northwest have roughly equal chances of being above, near, or below normal, reflecting greater uncertainty in those regions. Overall, most of the U.S. can expect an early, warmer start to spring, though cooler stretches may still occur in the northern and northeastern states. This forecast is based on the official 30‑day outlook discussion for April 2026 from the Climate Prediction Center of the National Oceanic and Atmospheric Administration.
March 20, 2026
Weekly Energy News
Market Commentary: The U.S. natural gas market recorded an unusual late-winter storage build of 35 Bcf for the week ending March 13, effectively erasing the deficit relative to the five-year average, according to the Energy Information Administration.
The reported injection aligned with consensus expectations from the weekly storage survey by Platts, part of S&P Global Energy, as unseasonably warm temperatures reduced heating demand during the period.
Following the report, NYMEX prompt-month Henry Hub futures showed minimal movement, hovering near $3.20 per MMBtu, based on data from CME Group.
April 2026 NYMEX closed Thursday at $3.168
· High for the day $3.270
· Low for the day $3.103
Early trading for the prompt month is trading at $3.074
· https://www.cmegroup.com/markets/energy/natural-gas/natural-gas.html
· https://www.fxempire.com/commodities/natural-gas
U.S. natural gas fundamentals loosened significantly during the week ending March 13, though analysts expect the market to shift back to withdrawals in the current week as colder weather returns.
Total demand fell by nearly 11 Bcf/d to around 108 Bcf/d, driven by weaker heating and power generation needs, according to S&P Global Energy CERA data. Residential and commercial demand dropped 27% week over week to 22 Bcf/d, while power sector demand declined 7% to roughly 29 Bcf/d.
On the supply side, total volumes decreased by more than 1 Bcf/d, largely due to lower imports from Canada, while U.S. dry gas production remained relatively steady.
More recently, demand has rebounded. In the six days through March 19, residential and commercial consumption jumped over 60% to nearly 33 Bcf/d compared to the same period the prior week, while power demand increased about 5% to approximately 31 Bcf/d. Supply has edged up 1%, primarily supported by stronger Canadian imports, with U.S. production still holding flat.
International: QatarEnergy reported significant damage to its LNG facilities at Ras Laffan Industrial City following recent Iranian missile strikes, with repairs expected to take 3–5 years. The disruption has taken roughly 17% of export capacity offline, including two liquefaction trains (4 and 6), totaling 12.8 mtpa. As a result, the company may declare force majeure on some long-term contracts, with supply impacts expected across Europe and Asia and an estimated $20 billion in annual revenue losses.
In response, U.S. LNG prices have surged to a three-year high. Strong global demand has pushed U.S. liquefaction utilization above typical levels, with plants operating well above capacity in recent months. March utilization is projected at 11.29 million mt—up 10% month over month and 20% year over year—though sustained operations 10–15% above capacity may be difficult to maintain.
EIA Storage: Working gas in storage totaled 1,883 Bcf as of Friday, March 13, 2026, according to EIA estimates, reflecting a 35 Bcf increase week over week. Inventories were 177 Bcf above year-ago levels and 47 Bcf higher than the five-year average of 1,836 Bcf. Overall, storage levels remain within the historical five-year range.
Note: The shaded area indicates the range between the historical minimum and maximum values for the weekly series from 2021 through 2025. The dashed vertical lines indicate current and year-ago weekly periods.
Weather: The April 2026 temperature outlook indicates that much of the U.S. is likely to experience warmer-than-normal conditions, with the strongest warmth expected across the South, Central states, and interior Northwest. This pattern is supported by current drought conditions, below-normal soil moisture, and below-average snowpack across much of the West, which will allow the land to heat up more quickly as spring progresses. Florida and Utah are particularly likely to see above-average temperatures, while northwestern Alaska may also experience warmer conditions. In contrast, parts of the Great Lakes, Northeast, Mid-Atlantic, and Pacific Northwest have roughly equal chances of being above, near, or below normal, reflecting greater uncertainty in those regions. Overall, most of the U.S. can expect an early, warmer start to spring, though cooler stretches may still occur in the northern and northeastern states. This forecast is based on the official 30‑day outlook discussion for April 2026 from the Climate Prediction Center of the National Oceanic and Atmospheric Administration.
Make Your Choice Gas Selection in Three Easy Steps
Click here to access our online tool, or call our Choice gas commodity experts at 1 (877) 790-4990.
Step 1: Enter your account number
- Your Black Hills Energy account number is located at the top right-hand corner of your bill.
Step 2: Review price options and make your selection
Step 3: Confirm your selection and enter your control number
- You received a control number in your 2026 Choice Gas selection packet mailed to you from Black Hills Energy. If you cannot locate this, you can retrieve your control number by calling 877-245-3506 or visit choicegas.com
Once enrolled, you will be removed from supplier marketing communications within 24 hours.


Sign Up for Our Energy Newsletters
Sign UpRecent Posts