February 27, 2026
Weekly Energy News
Market Commentary: Over the past trading week, natural gas futures on the New York Mercantile Exchange(NYMEX) continued to trend lower, as traders remained cautious amid forecasts calling for mild weather across the Lower 48 through mid-March.
According to the National Weather Service, most of the Lower 48—excluding New England—has a 60% to 70% probability of above-average temperatures from March 3–7. By March 11, the warmest conditions are expected to shift east, covering much of the Midwest and the Northeast.
On February 25, the March natural gas futures contract ended at $2.97/MMBtu. When the April contract became the prompt month, it immediately came under renewed selling pressure.
April 2026 NYMEX closed Thursday at $2.827
· High for the day $2.891
· Low for the day $2.775
Early trading for the prompt month is trading at $3.10
· https://www.cmegroup.com/markets/energy/natural-gas/natural-gas.html
· https://www.fxempire.com/commodities/natural-gas
EIA Storage: U.S. natural gas storage withdrawals eased for a third straight week in mid-February, as widespread mild weather across the Lower 48 continued to suppress heating demand.
The U.S. Energy Information Administration reported on February 26 that inventories declined by 52 Bcf for the prior week, bringing total U.S. storage levels down to 2.018 Tcf. The draw came in slightly above market expectations.
According to the Platts natural gas storage survey, analysts and market participants had been expecting a 50 Bcf withdrawal for the week ended February 20.
Immediately following the release of the storage report, the newly prompt April natural gas futures contract rose by about 4–5 cents, trading in the low $2.80/MMBtu range, according to data from CME Group. Prices then fluctuated in the low-$2.80s over the next hour.
The 52 Bcf draw was the smallest reported since late November 2025, reflecting a sharp moderation in winter heating demand as temperatures trended warmer across much of the country.
Despite being largely in line with expectations, the report was still considered underwhelming. Over the past five years, the average mid-February withdrawal has totaled 168 Bcf, and during the same week in 2025, inventories fell by more than 250 Bcf.
As of February 20, U.S. natural gas inventories stood just 7 Bcf (less than 1%) below the five-year average of 2.025 Tcf, and 141 Bcf (about 7.5%) above year-ago levels of 1.877 Tcf, according to EIA data.
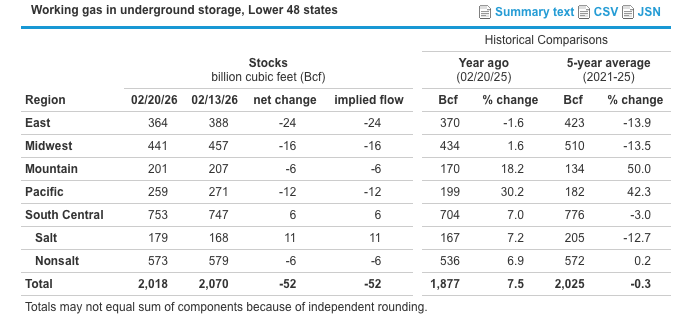
Summary: According to estimates from the U.S. Energy Information Administration, U.S. working natural gas in storage totaled 2,018 Bcf as of Friday, February 20, 2026—down 52 Bcf from the prior week.
Inventories were 141 Bcf higher than the same time last year and 7 Bcf below the five-year average of 2,025 Bcf. At 2,018 Bcf, total working gas remains within the five-year historical range.
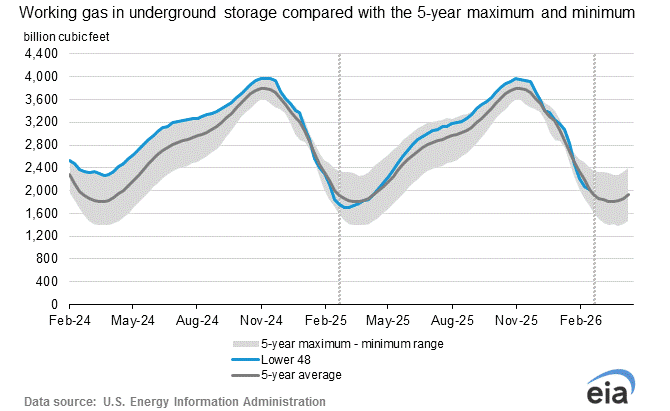
Note: The shaded area indicates the range between the historical minimum and maximum values for the weekly series from 2021 through 2025. The dashed vertical lines indicate current and year-ago weekly periods.
Weather: A noticeable weather pattern shift took place across North America in mid-February, moving away from the colder, blocked setup that dominated late January and early February. Since then, the flow has become more progressive, with a more active storm track and milder Pacific air spreading across much of the U.S.
Looking into early and mid-March, forecast models point to a north-shifted storm track and generally warmer-than-normal temperatures for most of the central and eastern U.S., with the best odds for warmth in the south-central Plains and Mississippi Valley. The Northeast is more uncertain, and small pockets of cooler weather are still possible in parts of the northern Plains and Pacific Northwest.
Alaska is expected to stay colder than normal, while precipitation is likely to be drier from California into the southern and central Plains, and wetter across the Pacific Northwest, Great Lakes, and Ohio Valley.
Source: Climate Prediction Center (NOAA) – https://www.cpc.ncep.noaa.gov/products/predictions/long_range/fxus07.html
Market Data:
February 27, 2026

Weekly Energy News
February 27, 2026
Market Commentary: Over the past trading week, natural gas futures on the New York Mercantile Exchange(NYMEX) continued to trend lower, as traders remained cautious amid forecasts calling for mild weather across the Lower 48 through mid-March.
According to the National Weather Service, most of the Lower 48—excluding New England—has a 60% to 70% probability of above-average temperatures from March 3–7. By March 11, the warmest conditions are expected to shift east, covering much of the Midwest and the Northeast.
On February 25, the March natural gas futures contract ended at $2.97/MMBtu. When the April contract became the prompt month, it immediately came under renewed selling pressure.
April 2026 NYMEX closed Thursday at $2.827
· High for the day $2.891
· Low for the day $2.775
Early trading for the prompt month is trading at $3.10
· https://www.cmegroup.com/markets/energy/natural-gas/natural-gas.html
· https://www.fxempire.com/commodities/natural-gas
EIA Storage: U.S. natural gas storage withdrawals eased for a third straight week in mid-February, as widespread mild weather across the Lower 48 continued to suppress heating demand.
The U.S. Energy Information Administration reported on February 26 that inventories declined by 52 Bcf for the prior week, bringing total U.S. storage levels down to 2.018 Tcf. The draw came in slightly above market expectations.
According to the Platts natural gas storage survey, analysts and market participants had been expecting a 50 Bcf withdrawal for the week ended February 20.
Immediately following the release of the storage report, the newly prompt April natural gas futures contract rose by about 4–5 cents, trading in the low $2.80/MMBtu range, according to data from CME Group. Prices then fluctuated in the low-$2.80s over the next hour.
The 52 Bcf draw was the smallest reported since late November 2025, reflecting a sharp moderation in winter heating demand as temperatures trended warmer across much of the country.
Despite being largely in line with expectations, the report was still considered underwhelming. Over the past five years, the average mid-February withdrawal has totaled 168 Bcf, and during the same week in 2025, inventories fell by more than 250 Bcf.
As of February 20, U.S. natural gas inventories stood just 7 Bcf (less than 1%) below the five-year average of 2.025 Tcf, and 141 Bcf (about 7.5%) above year-ago levels of 1.877 Tcf, according to EIA data.
Summary: According to estimates from the U.S. Energy Information Administration, U.S. working natural gas in storage totaled 2,018 Bcf as of Friday, February 20, 2026—down 52 Bcf from the prior week.
Inventories were 141 Bcf higher than the same time last year and 7 Bcf below the five-year average of 2,025 Bcf. At 2,018 Bcf, total working gas remains within the five-year historical range.
Note: The shaded area indicates the range between the historical minimum and maximum values for the weekly series from 2021 through 2025. The dashed vertical lines indicate current and year-ago weekly periods.
Weather: A noticeable weather pattern shift took place across North America in mid-February, moving away from the colder, blocked setup that dominated late January and early February. Since then, the flow has become more progressive, with a more active storm track and milder Pacific air spreading across much of the U.S.
Looking into early and mid-March, forecast models point to a north-shifted storm track and generally warmer-than-normal temperatures for most of the central and eastern U.S., with the best odds for warmth in the south-central Plains and Mississippi Valley. The Northeast is more uncertain, and small pockets of cooler weather are still possible in parts of the northern Plains and Pacific Northwest.
Alaska is expected to stay colder than normal, while precipitation is likely to be drier from California into the southern and central Plains, and wetter across the Pacific Northwest, Great Lakes, and Ohio Valley.
Source: Climate Prediction Center (NOAA) – https://www.cpc.ncep.noaa.gov/products/predictions/long_range/fxus07.html
Market Data:
February 27, 2026
February 27, 2026
Weekly Energy News
Market Commentary: Over the past trading week, natural gas futures on the New York Mercantile Exchange(NYMEX) continued to trend lower, as traders remained cautious amid forecasts calling for mild weather across the Lower 48 through mid-March.
According to the National Weather Service, most of the Lower 48—excluding New England—has a 60% to 70% probability of above-average temperatures from March 3–7. By March 11, the warmest conditions are expected to shift east, covering much of the Midwest and the Northeast.
On February 25, the March natural gas futures contract ended at $2.97/MMBtu. When the April contract became the prompt month, it immediately came under renewed selling pressure.
April 2026 NYMEX closed Thursday at $2.827
· High for the day $2.891
· Low for the day $2.775
Early trading for the prompt month is trading at $3.10
· https://www.cmegroup.com/markets/energy/natural-gas/natural-gas.html
· https://www.fxempire.com/commodities/natural-gas
EIA Storage: U.S. natural gas storage withdrawals eased for a third straight week in mid-February, as widespread mild weather across the Lower 48 continued to suppress heating demand.
The U.S. Energy Information Administration reported on February 26 that inventories declined by 52 Bcf for the prior week, bringing total U.S. storage levels down to 2.018 Tcf. The draw came in slightly above market expectations.
According to the Platts natural gas storage survey, analysts and market participants had been expecting a 50 Bcf withdrawal for the week ended February 20.
Immediately following the release of the storage report, the newly prompt April natural gas futures contract rose by about 4–5 cents, trading in the low $2.80/MMBtu range, according to data from CME Group. Prices then fluctuated in the low-$2.80s over the next hour.
The 52 Bcf draw was the smallest reported since late November 2025, reflecting a sharp moderation in winter heating demand as temperatures trended warmer across much of the country.
Despite being largely in line with expectations, the report was still considered underwhelming. Over the past five years, the average mid-February withdrawal has totaled 168 Bcf, and during the same week in 2025, inventories fell by more than 250 Bcf.
As of February 20, U.S. natural gas inventories stood just 7 Bcf (less than 1%) below the five-year average of 2.025 Tcf, and 141 Bcf (about 7.5%) above year-ago levels of 1.877 Tcf, according to EIA data.
Summary: According to estimates from the U.S. Energy Information Administration, U.S. working natural gas in storage totaled 2,018 Bcf as of Friday, February 20, 2026—down 52 Bcf from the prior week.
Inventories were 141 Bcf higher than the same time last year and 7 Bcf below the five-year average of 2,025 Bcf. At 2,018 Bcf, total working gas remains within the five-year historical range.
Note: The shaded area indicates the range between the historical minimum and maximum values for the weekly series from 2021 through 2025. The dashed vertical lines indicate current and year-ago weekly periods.
Weather: A noticeable weather pattern shift took place across North America in mid-February, moving away from the colder, blocked setup that dominated late January and early February. Since then, the flow has become more progressive, with a more active storm track and milder Pacific air spreading across much of the U.S.
Looking into early and mid-March, forecast models point to a north-shifted storm track and generally warmer-than-normal temperatures for most of the central and eastern U.S., with the best odds for warmth in the south-central Plains and Mississippi Valley. The Northeast is more uncertain, and small pockets of cooler weather are still possible in parts of the northern Plains and Pacific Northwest.
Alaska is expected to stay colder than normal, while precipitation is likely to be drier from California into the southern and central Plains, and wetter across the Pacific Northwest, Great Lakes, and Ohio Valley.
Source: Climate Prediction Center (NOAA) – https://www.cpc.ncep.noaa.gov/products/predictions/long_range/fxus07.html

February 27, 2026
Market Commentary: Over the past trading week, natural gas futures on the New York Mercantile Exchange(NYMEX) continued to trend lower, as traders remained cautious amid forecasts calling for mild weather across the Lower 48 through mid-March.
According to the National Weather Service, most of the Lower 48—excluding New England—has a 60% to 70% probability of above-average temperatures from March 3–7. By March 11, the warmest conditions are expected to shift east, covering much of the Midwest and the Northeast.
On February 25, the March natural gas futures contract ended at $2.97/MMBtu. When the April contract became the prompt month, it immediately came under renewed selling pressure.
April 2026 NYMEX closed Thursday at $2.827
· High for the day $2.891
· Low for the day $2.775
Early trading for the prompt month is trading at $3.10
· https://www.cmegroup.com/markets/energy/natural-gas/natural-gas.html
· https://www.fxempire.com/commodities/natural-gas
EIA Storage: U.S. natural gas storage withdrawals eased for a third straight week in mid-February, as widespread mild weather across the Lower 48 continued to suppress heating demand.
The U.S. Energy Information Administration reported on February 26 that inventories declined by 52 Bcf for the prior week, bringing total U.S. storage levels down to 2.018 Tcf. The draw came in slightly above market expectations.
According to the Platts natural gas storage survey, analysts and market participants had been expecting a 50 Bcf withdrawal for the week ended February 20.
Immediately following the release of the storage report, the newly prompt April natural gas futures contract rose by about 4–5 cents, trading in the low $2.80/MMBtu range, according to data from CME Group. Prices then fluctuated in the low-$2.80s over the next hour.
The 52 Bcf draw was the smallest reported since late November 2025, reflecting a sharp moderation in winter heating demand as temperatures trended warmer across much of the country.
Despite being largely in line with expectations, the report was still considered underwhelming. Over the past five years, the average mid-February withdrawal has totaled 168 Bcf, and during the same week in 2025, inventories fell by more than 250 Bcf.
As of February 20, U.S. natural gas inventories stood just 7 Bcf (less than 1%) below the five-year average of 2.025 Tcf, and 141 Bcf (about 7.5%) above year-ago levels of 1.877 Tcf, according to EIA data.
Summary: According to estimates from the U.S. Energy Information Administration, U.S. working natural gas in storage totaled 2,018 Bcf as of Friday, February 20, 2026—down 52 Bcf from the prior week.
Inventories were 141 Bcf higher than the same time last year and 7 Bcf below the five-year average of 2,025 Bcf. At 2,018 Bcf, total working gas remains within the five-year historical range.
Note: The shaded area indicates the range between the historical minimum and maximum values for the weekly series from 2021 through 2025. The dashed vertical lines indicate current and year-ago weekly periods.
Weather: A noticeable weather pattern shift took place across North America in mid-February, moving away from the colder, blocked setup that dominated late January and early February. Since then, the flow has become more progressive, with a more active storm track and milder Pacific air spreading across much of the U.S.
Looking into early and mid-March, forecast models point to a north-shifted storm track and generally warmer-than-normal temperatures for most of the central and eastern U.S., with the best odds for warmth in the south-central Plains and Mississippi Valley. The Northeast is more uncertain, and small pockets of cooler weather are still possible in parts of the northern Plains and Pacific Northwest.
Alaska is expected to stay colder than normal, while precipitation is likely to be drier from California into the southern and central Plains, and wetter across the Pacific Northwest, Great Lakes, and Ohio Valley.
Source: Climate Prediction Center (NOAA) – https://www.cpc.ncep.noaa.gov/products/predictions/long_range/fxus07.html
February 27, 2026
Weekly Energy News
Market Commentary: Over the past trading week, natural gas futures on the New York Mercantile Exchange(NYMEX) continued to trend lower, as traders remained cautious amid forecasts calling for mild weather across the Lower 48 through mid-March.
According to the National Weather Service, most of the Lower 48—excluding New England—has a 60% to 70% probability of above-average temperatures from March 3–7. By March 11, the warmest conditions are expected to shift east, covering much of the Midwest and the Northeast.
On February 25, the March natural gas futures contract ended at $2.97/MMBtu. When the April contract became the prompt month, it immediately came under renewed selling pressure.
April 2026 NYMEX closed Thursday at $2.827
· High for the day $2.891
· Low for the day $2.775
Early trading for the prompt month is trading at $3.10
· https://www.cmegroup.com/markets/energy/natural-gas/natural-gas.html
· https://www.fxempire.com/commodities/natural-gas
EIA Storage: U.S. natural gas storage withdrawals eased for a third straight week in mid-February, as widespread mild weather across the Lower 48 continued to suppress heating demand.
The U.S. Energy Information Administration reported on February 26 that inventories declined by 52 Bcf for the prior week, bringing total U.S. storage levels down to 2.018 Tcf. The draw came in slightly above market expectations.
According to the Platts natural gas storage survey, analysts and market participants had been expecting a 50 Bcf withdrawal for the week ended February 20.
Immediately following the release of the storage report, the newly prompt April natural gas futures contract rose by about 4–5 cents, trading in the low $2.80/MMBtu range, according to data from CME Group. Prices then fluctuated in the low-$2.80s over the next hour.
The 52 Bcf draw was the smallest reported since late November 2025, reflecting a sharp moderation in winter heating demand as temperatures trended warmer across much of the country.
Despite being largely in line with expectations, the report was still considered underwhelming. Over the past five years, the average mid-February withdrawal has totaled 168 Bcf, and during the same week in 2025, inventories fell by more than 250 Bcf.
As of February 20, U.S. natural gas inventories stood just 7 Bcf (less than 1%) below the five-year average of 2.025 Tcf, and 141 Bcf (about 7.5%) above year-ago levels of 1.877 Tcf, according to EIA data.
Summary: According to estimates from the U.S. Energy Information Administration, U.S. working natural gas in storage totaled 2,018 Bcf as of Friday, February 20, 2026—down 52 Bcf from the prior week.
Inventories were 141 Bcf higher than the same time last year and 7 Bcf below the five-year average of 2,025 Bcf. At 2,018 Bcf, total working gas remains within the five-year historical range.
Note: The shaded area indicates the range between the historical minimum and maximum values for the weekly series from 2021 through 2025. The dashed vertical lines indicate current and year-ago weekly periods.
Weather: A noticeable weather pattern shift took place across North America in mid-February, moving away from the colder, blocked setup that dominated late January and early February. Since then, the flow has become more progressive, with a more active storm track and milder Pacific air spreading across much of the U.S.
Looking into early and mid-March, forecast models point to a north-shifted storm track and generally warmer-than-normal temperatures for most of the central and eastern U.S., with the best odds for warmth in the south-central Plains and Mississippi Valley. The Northeast is more uncertain, and small pockets of cooler weather are still possible in parts of the northern Plains and Pacific Northwest.
Alaska is expected to stay colder than normal, while precipitation is likely to be drier from California into the southern and central Plains, and wetter across the Pacific Northwest, Great Lakes, and Ohio Valley.
Source: Climate Prediction Center (NOAA) – https://www.cpc.ncep.noaa.gov/products/predictions/long_range/fxus07.html
Make Your Choice Gas Selection in Three Easy Steps
Click here to access our online tool, or call our Choice gas commodity experts at 1 (877) 790-4990.
Step 1: Enter your account number
- Your Black Hills Energy account number is located at the top right-hand corner of your bill.
Step 2: Review price options and make your selection
Step 3: Confirm your selection and enter your control number
- You received a control number in your 2026 Choice Gas selection packet mailed to you from Black Hills Energy. If you cannot locate this, you can retrieve your control number by calling 877-245-3506 or visit choicegas.com
Once enrolled, you will be removed from supplier marketing communications within 24 hours.


Sign Up for Our Energy Newsletters
Sign Up