July 9, 2026
July 2026 – Energy News
Natural gas prices remain moderate heading into mid-summer 2026. The EIA's July STEO projects Henry Hub to average close to $3.60/MMBtu across 2026 and 2027 -- roughly 10% below the 2016-2025 historical average in real terms -- with record domestic production keeping a lid on the market despite rising heat-driven demand.
Storage inventories ended June 6% above the five-year average, and the EIA forecasts end-of-October stocks of 3,966 Bcf (5% above average), supporting a 4Q26 Henry Hub forecast of $3.57/MMBtu and full-year 2027 just under $3.50/MMBtu.
Domestic Demand
Power sector demand is the story this summer. The EIA projects natural gas consumption for electricity generation will average 42.2 Bcf/d through the summer months -- up 0.5 Bcf/d from 2025 -- with an eastern U.S. heatwave underway as the outlook was finalized posing upside risk to that figure.
Longer term, gas-fired generation is on track to set all-time records in 2027, reaching 38.1 Bcf/d annually and peaking at 50.6 Bcf/d in July 2027, driven by rising electricity demand, fleet expansion, and affordable gas prices. Lower gas costs are also pulling summer wholesale power prices down to a national average of $45/MWh -- $4/MWh below last summer.
International Demand
U.S. LNG export volumes continue to outpace forecasts. Gas flowing to export terminals has averaged approximately 18.85 Bcf/d so far in 2026, well above the EIA's 17.2 Bcf/d full-year projection, with 35 cargoes departing U.S. ports in the week ending June 24.
New capacity -- including Corpus Christi Stage 3 Trains 5-7 and Golden Pass Train 1 -- continues to ramp, with the EIA forecasting exports of 18.6 Bcf/d in 2027. Elevated summer temperatures in Europe and Asia are keeping international demand strong.
Production & Supply
Record domestic output -- led by Permian Basin associated gas and Haynesville Shale volumes near Gulf Coast export terminals -- is the primary reason prices remain contained and storage is running above average.
Working gas stood at 2,922 Bcf as of June 26 (175 Bcf above the five-year average), with inventories expected to reach 3,966 Bcf at end-of-October. As demand growth gradually absorbs that surplus through 2027, the EIA sees Henry Hub rising to $3.78/MMBtu in 4Q27.
Gulf of Mexico production and Gulf Coast infrastructure remain exposed to hurricane risk through Q3, with the Atlantic season now entering its most active window.
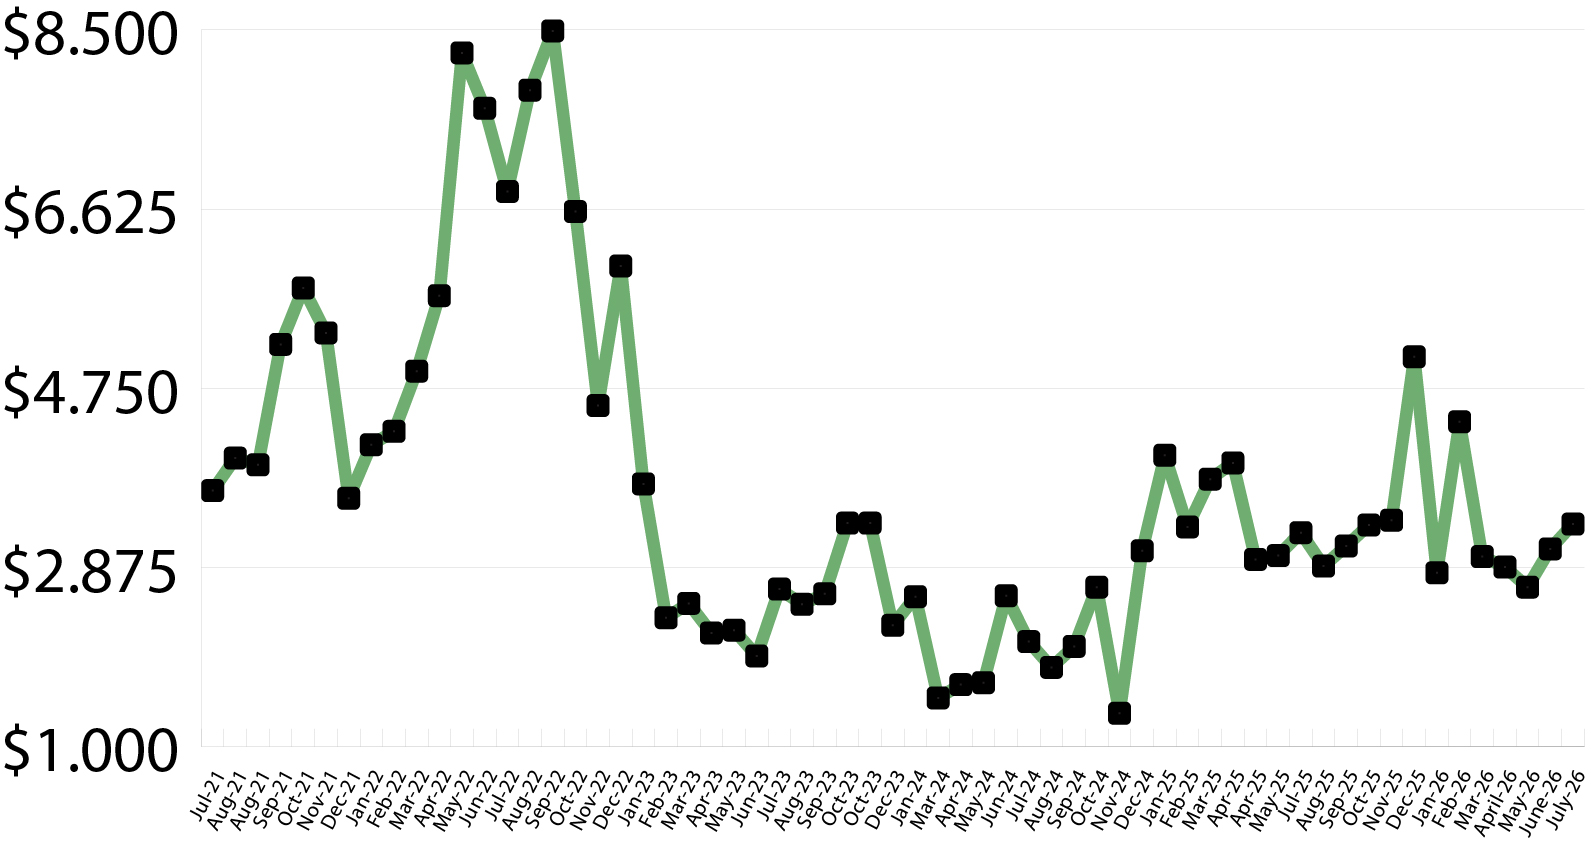
Market Data:
July 9, 2026

July 2026 – Energy News
July 9, 2026
Natural gas prices remain moderate heading into mid-summer 2026. The EIA's July STEO projects Henry Hub to average close to $3.60/MMBtu across 2026 and 2027 -- roughly 10% below the 2016-2025 historical average in real terms -- with record domestic production keeping a lid on the market despite rising heat-driven demand.
Storage inventories ended June 6% above the five-year average, and the EIA forecasts end-of-October stocks of 3,966 Bcf (5% above average), supporting a 4Q26 Henry Hub forecast of $3.57/MMBtu and full-year 2027 just under $3.50/MMBtu.
Domestic Demand
Power sector demand is the story this summer. The EIA projects natural gas consumption for electricity generation will average 42.2 Bcf/d through the summer months -- up 0.5 Bcf/d from 2025 -- with an eastern U.S. heatwave underway as the outlook was finalized posing upside risk to that figure.
Longer term, gas-fired generation is on track to set all-time records in 2027, reaching 38.1 Bcf/d annually and peaking at 50.6 Bcf/d in July 2027, driven by rising electricity demand, fleet expansion, and affordable gas prices. Lower gas costs are also pulling summer wholesale power prices down to a national average of $45/MWh -- $4/MWh below last summer.
International Demand
U.S. LNG export volumes continue to outpace forecasts. Gas flowing to export terminals has averaged approximately 18.85 Bcf/d so far in 2026, well above the EIA's 17.2 Bcf/d full-year projection, with 35 cargoes departing U.S. ports in the week ending June 24.
New capacity -- including Corpus Christi Stage 3 Trains 5-7 and Golden Pass Train 1 -- continues to ramp, with the EIA forecasting exports of 18.6 Bcf/d in 2027. Elevated summer temperatures in Europe and Asia are keeping international demand strong.
Production & Supply
Record domestic output -- led by Permian Basin associated gas and Haynesville Shale volumes near Gulf Coast export terminals -- is the primary reason prices remain contained and storage is running above average.
Working gas stood at 2,922 Bcf as of June 26 (175 Bcf above the five-year average), with inventories expected to reach 3,966 Bcf at end-of-October. As demand growth gradually absorbs that surplus through 2027, the EIA sees Henry Hub rising to $3.78/MMBtu in 4Q27.
Gulf of Mexico production and Gulf Coast infrastructure remain exposed to hurricane risk through Q3, with the Atlantic season now entering its most active window.
Market Data:
July 9, 2026
July 9, 2026
July 2026 – Energy News
Natural gas prices remain moderate heading into mid-summer 2026. The EIA's July STEO projects Henry Hub to average close to $3.60/MMBtu across 2026 and 2027 -- roughly 10% below the 2016-2025 historical average in real terms -- with record domestic production keeping a lid on the market despite rising heat-driven demand.
Storage inventories ended June 6% above the five-year average, and the EIA forecasts end-of-October stocks of 3,966 Bcf (5% above average), supporting a 4Q26 Henry Hub forecast of $3.57/MMBtu and full-year 2027 just under $3.50/MMBtu.
Domestic Demand
Power sector demand is the story this summer. The EIA projects natural gas consumption for electricity generation will average 42.2 Bcf/d through the summer months -- up 0.5 Bcf/d from 2025 -- with an eastern U.S. heatwave underway as the outlook was finalized posing upside risk to that figure.
Longer term, gas-fired generation is on track to set all-time records in 2027, reaching 38.1 Bcf/d annually and peaking at 50.6 Bcf/d in July 2027, driven by rising electricity demand, fleet expansion, and affordable gas prices. Lower gas costs are also pulling summer wholesale power prices down to a national average of $45/MWh -- $4/MWh below last summer.
International Demand
U.S. LNG export volumes continue to outpace forecasts. Gas flowing to export terminals has averaged approximately 18.85 Bcf/d so far in 2026, well above the EIA's 17.2 Bcf/d full-year projection, with 35 cargoes departing U.S. ports in the week ending June 24.
New capacity -- including Corpus Christi Stage 3 Trains 5-7 and Golden Pass Train 1 -- continues to ramp, with the EIA forecasting exports of 18.6 Bcf/d in 2027. Elevated summer temperatures in Europe and Asia are keeping international demand strong.
Production & Supply
Record domestic output -- led by Permian Basin associated gas and Haynesville Shale volumes near Gulf Coast export terminals -- is the primary reason prices remain contained and storage is running above average.
Working gas stood at 2,922 Bcf as of June 26 (175 Bcf above the five-year average), with inventories expected to reach 3,966 Bcf at end-of-October. As demand growth gradually absorbs that surplus through 2027, the EIA sees Henry Hub rising to $3.78/MMBtu in 4Q27.
Gulf of Mexico production and Gulf Coast infrastructure remain exposed to hurricane risk through Q3, with the Atlantic season now entering its most active window.
July 9, 2026
July 2026 – Energy News
Natural gas prices remain moderate heading into mid-summer 2026. The EIA's July STEO projects Henry Hub to average close to $3.60/MMBtu across 2026 and 2027 -- roughly 10% below the 2016-2025 historical average in real terms -- with record domestic production keeping a lid on the market despite rising heat-driven demand.
Storage inventories ended June 6% above the five-year average, and the EIA forecasts end-of-October stocks of 3,966 Bcf (5% above average), supporting a 4Q26 Henry Hub forecast of $3.57/MMBtu and full-year 2027 just under $3.50/MMBtu.
Domestic Demand
Power sector demand is the story this summer. The EIA projects natural gas consumption for electricity generation will average 42.2 Bcf/d through the summer months -- up 0.5 Bcf/d from 2025 -- with an eastern U.S. heatwave underway as the outlook was finalized posing upside risk to that figure.
Longer term, gas-fired generation is on track to set all-time records in 2027, reaching 38.1 Bcf/d annually and peaking at 50.6 Bcf/d in July 2027, driven by rising electricity demand, fleet expansion, and affordable gas prices. Lower gas costs are also pulling summer wholesale power prices down to a national average of $45/MWh -- $4/MWh below last summer.
International Demand
U.S. LNG export volumes continue to outpace forecasts. Gas flowing to export terminals has averaged approximately 18.85 Bcf/d so far in 2026, well above the EIA's 17.2 Bcf/d full-year projection, with 35 cargoes departing U.S. ports in the week ending June 24.
New capacity -- including Corpus Christi Stage 3 Trains 5-7 and Golden Pass Train 1 -- continues to ramp, with the EIA forecasting exports of 18.6 Bcf/d in 2027. Elevated summer temperatures in Europe and Asia are keeping international demand strong.
Production & Supply
Record domestic output -- led by Permian Basin associated gas and Haynesville Shale volumes near Gulf Coast export terminals -- is the primary reason prices remain contained and storage is running above average.
Working gas stood at 2,922 Bcf as of June 26 (175 Bcf above the five-year average), with inventories expected to reach 3,966 Bcf at end-of-October. As demand growth gradually absorbs that surplus through 2027, the EIA sees Henry Hub rising to $3.78/MMBtu in 4Q27.
Gulf of Mexico production and Gulf Coast infrastructure remain exposed to hurricane risk through Q3, with the Atlantic season now entering its most active window.
July 9, 2026
July 2026 – Energy News
Natural gas prices remain moderate heading into mid-summer 2026. The EIA's July STEO projects Henry Hub to average close to $3.60/MMBtu across 2026 and 2027 -- roughly 10% below the 2016-2025 historical average in real terms -- with record domestic production keeping a lid on the market despite rising heat-driven demand.
Storage inventories ended June 6% above the five-year average, and the EIA forecasts end-of-October stocks of 3,966 Bcf (5% above average), supporting a 4Q26 Henry Hub forecast of $3.57/MMBtu and full-year 2027 just under $3.50/MMBtu.
Domestic Demand
Power sector demand is the story this summer. The EIA projects natural gas consumption for electricity generation will average 42.2 Bcf/d through the summer months -- up 0.5 Bcf/d from 2025 -- with an eastern U.S. heatwave underway as the outlook was finalized posing upside risk to that figure.
Longer term, gas-fired generation is on track to set all-time records in 2027, reaching 38.1 Bcf/d annually and peaking at 50.6 Bcf/d in July 2027, driven by rising electricity demand, fleet expansion, and affordable gas prices. Lower gas costs are also pulling summer wholesale power prices down to a national average of $45/MWh -- $4/MWh below last summer.
International Demand
U.S. LNG export volumes continue to outpace forecasts. Gas flowing to export terminals has averaged approximately 18.85 Bcf/d so far in 2026, well above the EIA's 17.2 Bcf/d full-year projection, with 35 cargoes departing U.S. ports in the week ending June 24.
New capacity -- including Corpus Christi Stage 3 Trains 5-7 and Golden Pass Train 1 -- continues to ramp, with the EIA forecasting exports of 18.6 Bcf/d in 2027. Elevated summer temperatures in Europe and Asia are keeping international demand strong.
Production & Supply
Record domestic output -- led by Permian Basin associated gas and Haynesville Shale volumes near Gulf Coast export terminals -- is the primary reason prices remain contained and storage is running above average.
Working gas stood at 2,922 Bcf as of June 26 (175 Bcf above the five-year average), with inventories expected to reach 3,966 Bcf at end-of-October. As demand growth gradually absorbs that surplus through 2027, the EIA sees Henry Hub rising to $3.78/MMBtu in 4Q27.
Gulf of Mexico production and Gulf Coast infrastructure remain exposed to hurricane risk through Q3, with the Atlantic season now entering its most active window.

July 9, 2026
Natural gas prices remain moderate heading into mid-summer 2026. The EIA's July STEO projects Henry Hub to average close to $3.60/MMBtu across 2026 and 2027 -- roughly 10% below the 2016-2025 historical average in real terms -- with record domestic production keeping a lid on the market despite rising heat-driven demand.
Storage inventories ended June 6% above the five-year average, and the EIA forecasts end-of-October stocks of 3,966 Bcf (5% above average), supporting a 4Q26 Henry Hub forecast of $3.57/MMBtu and full-year 2027 just under $3.50/MMBtu.
Domestic Demand
Power sector demand is the story this summer. The EIA projects natural gas consumption for electricity generation will average 42.2 Bcf/d through the summer months -- up 0.5 Bcf/d from 2025 -- with an eastern U.S. heatwave underway as the outlook was finalized posing upside risk to that figure.
Longer term, gas-fired generation is on track to set all-time records in 2027, reaching 38.1 Bcf/d annually and peaking at 50.6 Bcf/d in July 2027, driven by rising electricity demand, fleet expansion, and affordable gas prices. Lower gas costs are also pulling summer wholesale power prices down to a national average of $45/MWh -- $4/MWh below last summer.
International Demand
U.S. LNG export volumes continue to outpace forecasts. Gas flowing to export terminals has averaged approximately 18.85 Bcf/d so far in 2026, well above the EIA's 17.2 Bcf/d full-year projection, with 35 cargoes departing U.S. ports in the week ending June 24.
New capacity -- including Corpus Christi Stage 3 Trains 5-7 and Golden Pass Train 1 -- continues to ramp, with the EIA forecasting exports of 18.6 Bcf/d in 2027. Elevated summer temperatures in Europe and Asia are keeping international demand strong.
Production & Supply
Record domestic output -- led by Permian Basin associated gas and Haynesville Shale volumes near Gulf Coast export terminals -- is the primary reason prices remain contained and storage is running above average.
Working gas stood at 2,922 Bcf as of June 26 (175 Bcf above the five-year average), with inventories expected to reach 3,966 Bcf at end-of-October. As demand growth gradually absorbs that surplus through 2027, the EIA sees Henry Hub rising to $3.78/MMBtu in 4Q27.
Gulf of Mexico production and Gulf Coast infrastructure remain exposed to hurricane risk through Q3, with the Atlantic season now entering its most active window.
July 9, 2026
July 2026 – Energy News
Natural gas prices remain moderate heading into mid-summer 2026. The EIA's July STEO projects Henry Hub to average close to $3.60/MMBtu across 2026 and 2027 -- roughly 10% below the 2016-2025 historical average in real terms -- with record domestic production keeping a lid on the market despite rising heat-driven demand.
Storage inventories ended June 6% above the five-year average, and the EIA forecasts end-of-October stocks of 3,966 Bcf (5% above average), supporting a 4Q26 Henry Hub forecast of $3.57/MMBtu and full-year 2027 just under $3.50/MMBtu.
Domestic Demand
Power sector demand is the story this summer. The EIA projects natural gas consumption for electricity generation will average 42.2 Bcf/d through the summer months -- up 0.5 Bcf/d from 2025 -- with an eastern U.S. heatwave underway as the outlook was finalized posing upside risk to that figure.
Longer term, gas-fired generation is on track to set all-time records in 2027, reaching 38.1 Bcf/d annually and peaking at 50.6 Bcf/d in July 2027, driven by rising electricity demand, fleet expansion, and affordable gas prices. Lower gas costs are also pulling summer wholesale power prices down to a national average of $45/MWh -- $4/MWh below last summer.
International Demand
U.S. LNG export volumes continue to outpace forecasts. Gas flowing to export terminals has averaged approximately 18.85 Bcf/d so far in 2026, well above the EIA's 17.2 Bcf/d full-year projection, with 35 cargoes departing U.S. ports in the week ending June 24.
New capacity -- including Corpus Christi Stage 3 Trains 5-7 and Golden Pass Train 1 -- continues to ramp, with the EIA forecasting exports of 18.6 Bcf/d in 2027. Elevated summer temperatures in Europe and Asia are keeping international demand strong.
Production & Supply
Record domestic output -- led by Permian Basin associated gas and Haynesville Shale volumes near Gulf Coast export terminals -- is the primary reason prices remain contained and storage is running above average.
Working gas stood at 2,922 Bcf as of June 26 (175 Bcf above the five-year average), with inventories expected to reach 3,966 Bcf at end-of-October. As demand growth gradually absorbs that surplus through 2027, the EIA sees Henry Hub rising to $3.78/MMBtu in 4Q27.
Gulf of Mexico production and Gulf Coast infrastructure remain exposed to hurricane risk through Q3, with the Atlantic season now entering its most active window.
July 9, 2026
July 2026 – Energy News
Natural gas prices remain moderate heading into mid-summer 2026. The EIA's July STEO projects Henry Hub to average close to $3.60/MMBtu across 2026 and 2027 -- roughly 10% below the 2016-2025 historical average in real terms -- with record domestic production keeping a lid on the market despite rising heat-driven demand.
Storage inventories ended June 6% above the five-year average, and the EIA forecasts end-of-October stocks of 3,966 Bcf (5% above average), supporting a 4Q26 Henry Hub forecast of $3.57/MMBtu and full-year 2027 just under $3.50/MMBtu.
Domestic Demand
Power sector demand is the story this summer. The EIA projects natural gas consumption for electricity generation will average 42.2 Bcf/d through the summer months -- up 0.5 Bcf/d from 2025 -- with an eastern U.S. heatwave underway as the outlook was finalized posing upside risk to that figure.
Longer term, gas-fired generation is on track to set all-time records in 2027, reaching 38.1 Bcf/d annually and peaking at 50.6 Bcf/d in July 2027, driven by rising electricity demand, fleet expansion, and affordable gas prices. Lower gas costs are also pulling summer wholesale power prices down to a national average of $45/MWh -- $4/MWh below last summer.
International Demand
U.S. LNG export volumes continue to outpace forecasts. Gas flowing to export terminals has averaged approximately 18.85 Bcf/d so far in 2026, well above the EIA's 17.2 Bcf/d full-year projection, with 35 cargoes departing U.S. ports in the week ending June 24.
New capacity -- including Corpus Christi Stage 3 Trains 5-7 and Golden Pass Train 1 -- continues to ramp, with the EIA forecasting exports of 18.6 Bcf/d in 2027. Elevated summer temperatures in Europe and Asia are keeping international demand strong.
Production & Supply
Record domestic output -- led by Permian Basin associated gas and Haynesville Shale volumes near Gulf Coast export terminals -- is the primary reason prices remain contained and storage is running above average.
Working gas stood at 2,922 Bcf as of June 26 (175 Bcf above the five-year average), with inventories expected to reach 3,966 Bcf at end-of-October. As demand growth gradually absorbs that surplus through 2027, the EIA sees Henry Hub rising to $3.78/MMBtu in 4Q27.
Gulf of Mexico production and Gulf Coast infrastructure remain exposed to hurricane risk through Q3, with the Atlantic season now entering its most active window.
Make Your Choice Gas Selection in Three Easy Steps
Click here to access our online tool, or call our Choice gas commodity experts at 1 (877) 790-4990.
Step 1: Enter your account number
- Your Black Hills Energy account number is located at the top right-hand corner of your bill.
Step 2: Review price options and make your selection
Step 3: Confirm your selection and enter your control number
- You received a control number in your 2026 Choice Gas selection packet mailed to you from Black Hills Energy. If you cannot locate this, you can retrieve your control number by calling 877-245-3506 or visit choicegas.com
Once enrolled, you will be removed from supplier marketing communications within 24 hours.


Sign Up for Our Energy Newsletters
Sign UpRecent Posts