
January 14, 2026
January 2026 – Energy News
The U.S. natural gas market begins the year with increased domestic demand, record liquefied natural gas (LNG) exports, and legislation aimed at improving U.S. natural gas production.
Domestic Demand
The most recent report from the U.S. Energy Information Administration (EIA) indicates that the demand for natural gas in the U.S. has reached 138.72 billion cubic feet per day (Bcf/d), which is an 8 percent increase compared to last year. This total includes 47 Bcf/d for residential and commercial use, representing a 20 percent rise from the previous year. Industrial demand has decreased to 23.6 Bcf/d, a 7 percent drop from last year, while the demand for natural gas in electric power generation is at 34.7 Bcf/d, down 1.4 percent from last year.
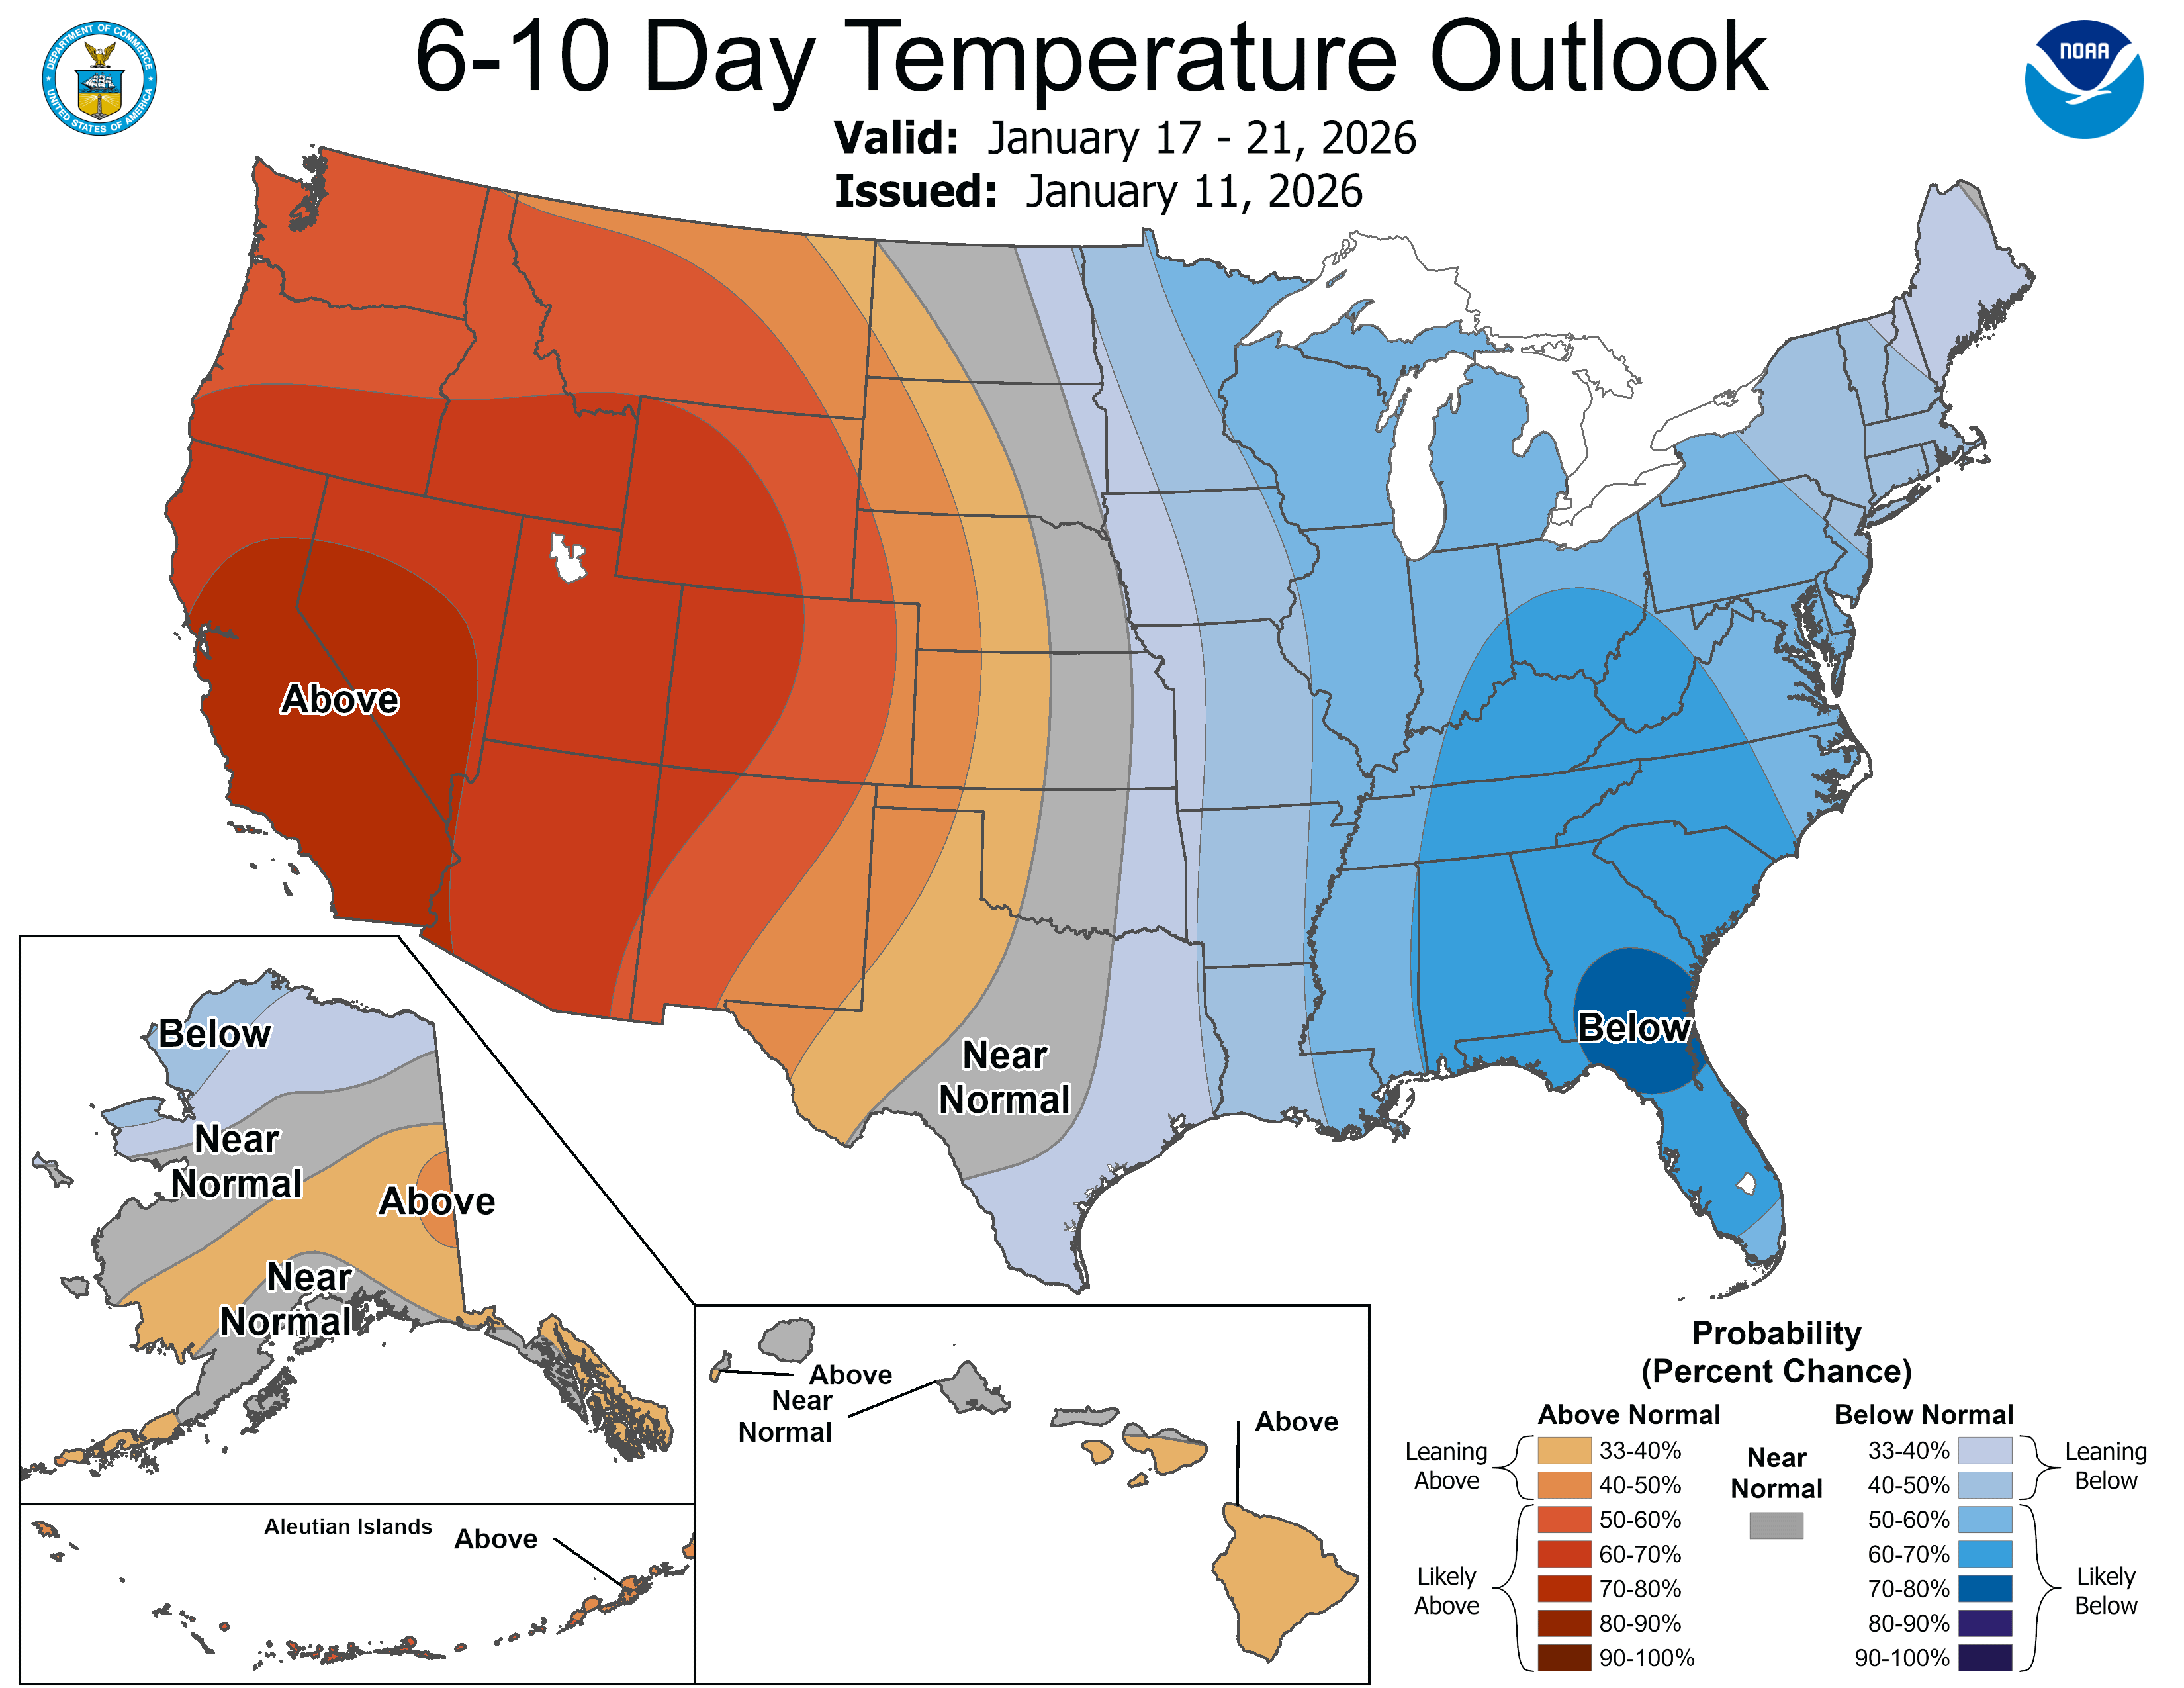
Weather is a major factor in domestic demand across the U.S. The National Oceanic and Atmospheric Administration (NOAA) recently issued its 6-10 Day Temperature Outlook, predicting below-normal temperatures across much of the Midwest, Northeast, and Southern regions of the country. This significant drop in temperatures could lead to increased heating needs, further boosting demand for natural gas.
International Demand
In 2025, the U.S. achieved a record global export of 111 million metric tons (mmt) of LNG. This volume surpassed Qatar's exports by nearly 20 mmt and exceeded the previous year's shipments by 23 mmt. The U.S. accounted for about a quarter of global LNG exports. In December, exports peaked at an unprecedented 11.5 mmt, setting a new monthly record. Throughout 2025, the U.S. established itself as a leader in the LNG market by setting five monthly production records.
In December, Europe remained the largest destination for U.S. LNG, importing nine mmt due to colder winter conditions that boosted demand and a continued shift away from Russian gas supplies. Additionally, Turkey increased its LNG purchases to 1.45 mmt during that month.
Production & Supply
Last year ended with natural gas storage at 3,375 billion cubic feet (Bcf). This is 1.6 percent lower than the amount recorded at the same time last year, but it is 1.0 percent above the five-year average. Although we are above the five-year average, it's important to note that the U.S. began 2025 with storage levels that were 6.5 percent higher than the five-year average for 2026.
At the end of the year, the U.S. natural gas rig count stood at 125, marking a 21.4 percent increase compared to the previous year. This growth reflects a rise from the beginning of the year, when the rig count was 103, which was 12.7 percent lower than the count at the start of 2024. The total U.S. natural gas supply has also grown, currently at 115.9 Bcf/d, up from 110.8 Bcf/d at the same time last year.
As we look toward longer-term production in the U.S., Rep. Bruce Westerman (R-AR) and Rep. Jared Golden (D-ME) introduced the bipartisan SPEED Act in July 2025. This legislation aims to streamline federal permitting under the National Environmental Policy Act (NEPA) by setting stricter timelines and reducing delays for energy infrastructure projects like pipelines and LNG export facilities. The House has passed the bill, but it still requires Senate consideration to be codified into law.
If you have any questions about the information in this newsletter or would like to talk to someone about your natural gas, please call your sales representative.
Market Data:
January 14, 2026

January 2026 – Energy News
January 14, 2026
The U.S. natural gas market begins the year with increased domestic demand, record liquefied natural gas (LNG) exports, and legislation aimed at improving U.S. natural gas production.
Domestic Demand
The most recent report from the U.S. Energy Information Administration (EIA) indicates that the demand for natural gas in the U.S. has reached 138.72 billion cubic feet per day (Bcf/d), which is an 8 percent increase compared to last year. This total includes 47 Bcf/d for residential and commercial use, representing a 20 percent rise from the previous year. Industrial demand has decreased to 23.6 Bcf/d, a 7 percent drop from last year, while the demand for natural gas in electric power generation is at 34.7 Bcf/d, down 1.4 percent from last year.
Weather is a major factor in domestic demand across the U.S. The National Oceanic and Atmospheric Administration (NOAA) recently issued its 6-10 Day Temperature Outlook, predicting below-normal temperatures across much of the Midwest, Northeast, and Southern regions of the country. This significant drop in temperatures could lead to increased heating needs, further boosting demand for natural gas.
International Demand
In 2025, the U.S. achieved a record global export of 111 million metric tons (mmt) of LNG. This volume surpassed Qatar's exports by nearly 20 mmt and exceeded the previous year's shipments by 23 mmt. The U.S. accounted for about a quarter of global LNG exports. In December, exports peaked at an unprecedented 11.5 mmt, setting a new monthly record. Throughout 2025, the U.S. established itself as a leader in the LNG market by setting five monthly production records.
In December, Europe remained the largest destination for U.S. LNG, importing nine mmt due to colder winter conditions that boosted demand and a continued shift away from Russian gas supplies. Additionally, Turkey increased its LNG purchases to 1.45 mmt during that month.
Production & Supply
Last year ended with natural gas storage at 3,375 billion cubic feet (Bcf). This is 1.6 percent lower than the amount recorded at the same time last year, but it is 1.0 percent above the five-year average. Although we are above the five-year average, it's important to note that the U.S. began 2025 with storage levels that were 6.5 percent higher than the five-year average for 2026.
At the end of the year, the U.S. natural gas rig count stood at 125, marking a 21.4 percent increase compared to the previous year. This growth reflects a rise from the beginning of the year, when the rig count was 103, which was 12.7 percent lower than the count at the start of 2024. The total U.S. natural gas supply has also grown, currently at 115.9 Bcf/d, up from 110.8 Bcf/d at the same time last year.
As we look toward longer-term production in the U.S., Rep. Bruce Westerman (R-AR) and Rep. Jared Golden (D-ME) introduced the bipartisan SPEED Act in July 2025. This legislation aims to streamline federal permitting under the National Environmental Policy Act (NEPA) by setting stricter timelines and reducing delays for energy infrastructure projects like pipelines and LNG export facilities. The House has passed the bill, but it still requires Senate consideration to be codified into law.
If you have any questions about the information in this newsletter or would like to talk to someone about your natural gas, please call your sales representative.
Market Data:
January 14, 2026
January 14, 2026
January 2026 – Energy News
The U.S. natural gas market begins the year with increased domestic demand, record liquefied natural gas (LNG) exports, and legislation aimed at improving U.S. natural gas production.
Domestic Demand
The most recent report from the U.S. Energy Information Administration (EIA) indicates that the demand for natural gas in the U.S. has reached 138.72 billion cubic feet per day (Bcf/d), which is an 8 percent increase compared to last year. This total includes 47 Bcf/d for residential and commercial use, representing a 20 percent rise from the previous year. Industrial demand has decreased to 23.6 Bcf/d, a 7 percent drop from last year, while the demand for natural gas in electric power generation is at 34.7 Bcf/d, down 1.4 percent from last year.
Weather is a major factor in domestic demand across the U.S. The National Oceanic and Atmospheric Administration (NOAA) recently issued its 6-10 Day Temperature Outlook, predicting below-normal temperatures across much of the Midwest, Northeast, and Southern regions of the country. This significant drop in temperatures could lead to increased heating needs, further boosting demand for natural gas.
International Demand
In 2025, the U.S. achieved a record global export of 111 million metric tons (mmt) of LNG. This volume surpassed Qatar's exports by nearly 20 mmt and exceeded the previous year's shipments by 23 mmt. The U.S. accounted for about a quarter of global LNG exports. In December, exports peaked at an unprecedented 11.5 mmt, setting a new monthly record. Throughout 2025, the U.S. established itself as a leader in the LNG market by setting five monthly production records.
In December, Europe remained the largest destination for U.S. LNG, importing nine mmt due to colder winter conditions that boosted demand and a continued shift away from Russian gas supplies. Additionally, Turkey increased its LNG purchases to 1.45 mmt during that month.
Production & Supply
Last year ended with natural gas storage at 3,375 billion cubic feet (Bcf). This is 1.6 percent lower than the amount recorded at the same time last year, but it is 1.0 percent above the five-year average. Although we are above the five-year average, it's important to note that the U.S. began 2025 with storage levels that were 6.5 percent higher than the five-year average for 2026.
At the end of the year, the U.S. natural gas rig count stood at 125, marking a 21.4 percent increase compared to the previous year. This growth reflects a rise from the beginning of the year, when the rig count was 103, which was 12.7 percent lower than the count at the start of 2024. The total U.S. natural gas supply has also grown, currently at 115.9 Bcf/d, up from 110.8 Bcf/d at the same time last year.
As we look toward longer-term production in the U.S., Rep. Bruce Westerman (R-AR) and Rep. Jared Golden (D-ME) introduced the bipartisan SPEED Act in July 2025. This legislation aims to streamline federal permitting under the National Environmental Policy Act (NEPA) by setting stricter timelines and reducing delays for energy infrastructure projects like pipelines and LNG export facilities. The House has passed the bill, but it still requires Senate consideration to be codified into law.
If you have any questions about the information in this newsletter or would like to talk to someone about your natural gas, please call your sales representative.

January 14, 2026
The U.S. natural gas market begins the year with increased domestic demand, record liquefied natural gas (LNG) exports, and legislation aimed at improving U.S. natural gas production.
Domestic Demand
The most recent report from the U.S. Energy Information Administration (EIA) indicates that the demand for natural gas in the U.S. has reached 138.72 billion cubic feet per day (Bcf/d), which is an 8 percent increase compared to last year. This total includes 47 Bcf/d for residential and commercial use, representing a 20 percent rise from the previous year. Industrial demand has decreased to 23.6 Bcf/d, a 7 percent drop from last year, while the demand for natural gas in electric power generation is at 34.7 Bcf/d, down 1.4 percent from last year.
Weather is a major factor in domestic demand across the U.S. The National Oceanic and Atmospheric Administration (NOAA) recently issued its 6-10 Day Temperature Outlook, predicting below-normal temperatures across much of the Midwest, Northeast, and Southern regions of the country. This significant drop in temperatures could lead to increased heating needs, further boosting demand for natural gas.
International Demand
In 2025, the U.S. achieved a record global export of 111 million metric tons (mmt) of LNG. This volume surpassed Qatar's exports by nearly 20 mmt and exceeded the previous year's shipments by 23 mmt. The U.S. accounted for about a quarter of global LNG exports. In December, exports peaked at an unprecedented 11.5 mmt, setting a new monthly record. Throughout 2025, the U.S. established itself as a leader in the LNG market by setting five monthly production records.
In December, Europe remained the largest destination for U.S. LNG, importing nine mmt due to colder winter conditions that boosted demand and a continued shift away from Russian gas supplies. Additionally, Turkey increased its LNG purchases to 1.45 mmt during that month.
Production & Supply
Last year ended with natural gas storage at 3,375 billion cubic feet (Bcf). This is 1.6 percent lower than the amount recorded at the same time last year, but it is 1.0 percent above the five-year average. Although we are above the five-year average, it's important to note that the U.S. began 2025 with storage levels that were 6.5 percent higher than the five-year average for 2026.
At the end of the year, the U.S. natural gas rig count stood at 125, marking a 21.4 percent increase compared to the previous year. This growth reflects a rise from the beginning of the year, when the rig count was 103, which was 12.7 percent lower than the count at the start of 2024. The total U.S. natural gas supply has also grown, currently at 115.9 Bcf/d, up from 110.8 Bcf/d at the same time last year.
As we look toward longer-term production in the U.S., Rep. Bruce Westerman (R-AR) and Rep. Jared Golden (D-ME) introduced the bipartisan SPEED Act in July 2025. This legislation aims to streamline federal permitting under the National Environmental Policy Act (NEPA) by setting stricter timelines and reducing delays for energy infrastructure projects like pipelines and LNG export facilities. The House has passed the bill, but it still requires Senate consideration to be codified into law.
If you have any questions about the information in this newsletter or would like to talk to someone about your natural gas, please call your sales representative.
January 14, 2026
January 2026 – Energy News
The U.S. natural gas market begins the year with increased domestic demand, record liquefied natural gas (LNG) exports, and legislation aimed at improving U.S. natural gas production.
Domestic Demand
The most recent report from the U.S. Energy Information Administration (EIA) indicates that the demand for natural gas in the U.S. has reached 138.72 billion cubic feet per day (Bcf/d), which is an 8 percent increase compared to last year. This total includes 47 Bcf/d for residential and commercial use, representing a 20 percent rise from the previous year. Industrial demand has decreased to 23.6 Bcf/d, a 7 percent drop from last year, while the demand for natural gas in electric power generation is at 34.7 Bcf/d, down 1.4 percent from last year.
Weather is a major factor in domestic demand across the U.S. The National Oceanic and Atmospheric Administration (NOAA) recently issued its 6-10 Day Temperature Outlook, predicting below-normal temperatures across much of the Midwest, Northeast, and Southern regions of the country. This significant drop in temperatures could lead to increased heating needs, further boosting demand for natural gas.
International Demand
In 2025, the U.S. achieved a record global export of 111 million metric tons (mmt) of LNG. This volume surpassed Qatar's exports by nearly 20 mmt and exceeded the previous year's shipments by 23 mmt. The U.S. accounted for about a quarter of global LNG exports. In December, exports peaked at an unprecedented 11.5 mmt, setting a new monthly record. Throughout 2025, the U.S. established itself as a leader in the LNG market by setting five monthly production records.
In December, Europe remained the largest destination for U.S. LNG, importing nine mmt due to colder winter conditions that boosted demand and a continued shift away from Russian gas supplies. Additionally, Turkey increased its LNG purchases to 1.45 mmt during that month.
Production & Supply
Last year ended with natural gas storage at 3,375 billion cubic feet (Bcf). This is 1.6 percent lower than the amount recorded at the same time last year, but it is 1.0 percent above the five-year average. Although we are above the five-year average, it's important to note that the U.S. began 2025 with storage levels that were 6.5 percent higher than the five-year average for 2026.
At the end of the year, the U.S. natural gas rig count stood at 125, marking a 21.4 percent increase compared to the previous year. This growth reflects a rise from the beginning of the year, when the rig count was 103, which was 12.7 percent lower than the count at the start of 2024. The total U.S. natural gas supply has also grown, currently at 115.9 Bcf/d, up from 110.8 Bcf/d at the same time last year.
As we look toward longer-term production in the U.S., Rep. Bruce Westerman (R-AR) and Rep. Jared Golden (D-ME) introduced the bipartisan SPEED Act in July 2025. This legislation aims to streamline federal permitting under the National Environmental Policy Act (NEPA) by setting stricter timelines and reducing delays for energy infrastructure projects like pipelines and LNG export facilities. The House has passed the bill, but it still requires Senate consideration to be codified into law.
If you have any questions about the information in this newsletter or would like to talk to someone about your natural gas, please call your sales representative.
Make Your Choice Gas Selection in Three Easy Steps
Click here to access our online tool, or call our Choice gas commodity experts at 1 (877) 790-4990.
Step 1: Enter your account number
- Your Black Hills Energy account number is located at the top right-hand corner of your bill.
Step 2: Review price options and make your selection
Step 3: Confirm your selection and enter your control number
- You received a control number in your 2026 Choice Gas selection packet mailed to you from Black Hills Energy. If you cannot locate this, you can retrieve your control number by calling 877-245-3506 or visit choicegas.com
Once enrolled, you will be removed from supplier marketing communications within 24 hours.


Sign Up for Our Energy Newsletters
Sign Up